Ottawa Market Remains Steady as Delayed Spring Spurs Buyer Confidence
June 6, 2025
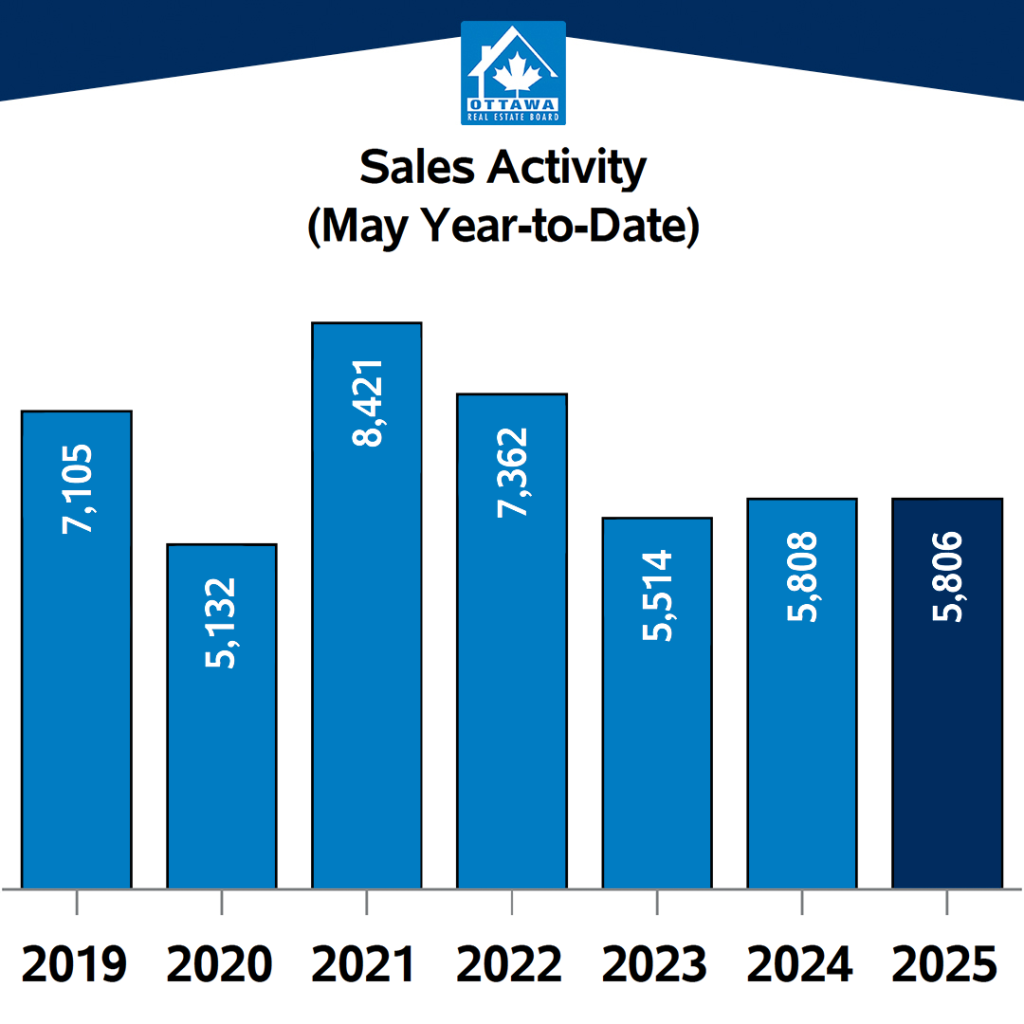
The number of homes sold through the MLS® System of the Ottawa Real Estate Board (OREB) totaled 1,807 units in May 2025. This represented a 33.1% increase from the previous month, but a more modest 14.9% increase from May 2024 and 2.5% above the five-year average.*
“Year-to-date home sales activity remains in line with 2024; however, the 33.1% surge over April 2025 suggests we’re experiencing a delayed spring market,” says OREB President Paul Czan. “April’s federal election took up real estate in consumers’ minds. Now, we’re seeing a shift in the marketplace, with active listings on the rise and months of inventory holding steady. Buyers appear to be gaining confidence, re-entering the market and transacting. For sellers, however, rising inventory means that competitive pricing and strong presentation are more critical than ever.”
“Compared to markets like Toronto or Vancouver—which are seeing signs of stagnation—Ottawa is holding steady,” adds Czan. “Buyers and sellers are still able to transact fairly, with sale prices remaining close to list, even amid broader economic uncertainty. And the Bank of Canada’s recent decision to hold the key interest rate steady may spur more activity, as buyers grow more confident, they’re not missing out on further downward movement.”
By the Numbers – Prices:
- The overall MLS® HPI composite benchmark price was $629,800 in May 2025; a 0.8% rise compared to May 2024.
- The benchmark price for single-family homes was $700,000, up 0.6% year-over-year in May.
- By comparison, the benchmark price for a townhouse/row unit** was $446,900, an increase of 3.4% from 2024.
- The benchmark apartment price was $404,700, a 3.6% decline from the previous year.
- The average price of homes sold in May 2025 was $728,623 a 4.8% increase from May 2024.
- The total dollar volume of all home sales in May 2025 amounted to $1.316 billion, a 20.4% increase compared to the same period last year.
OREB cautions that the average sale price can be useful in establishing trends over time but should not be used as an indicator that specific properties have increased or decreased in value. The calculation of the average sale price is based on the total dollar volume of all properties sold. Prices will vary from neighbourhood to neighbourhood.
By the Numbers – Inventory & New Listings:
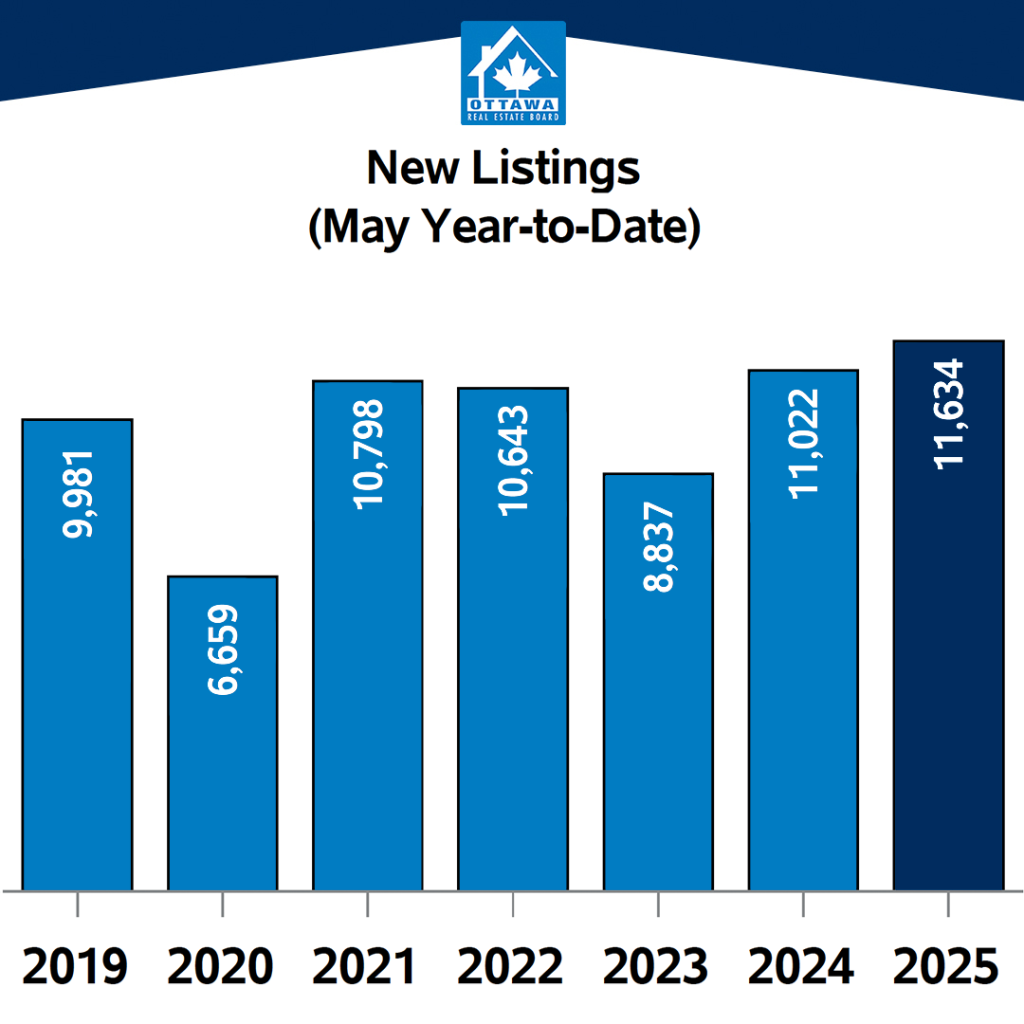
- The number of new listings increased by 8.7% compared to May 2024, with 3,430 new residential properties added to the market. New listings were 15.8% above the five-year average.
- Active residential listings totaled 4,347 units at the end of May 2025, reflecting a 13.5% surge from May 2024. Active listings were 54.2% above the five-year average.
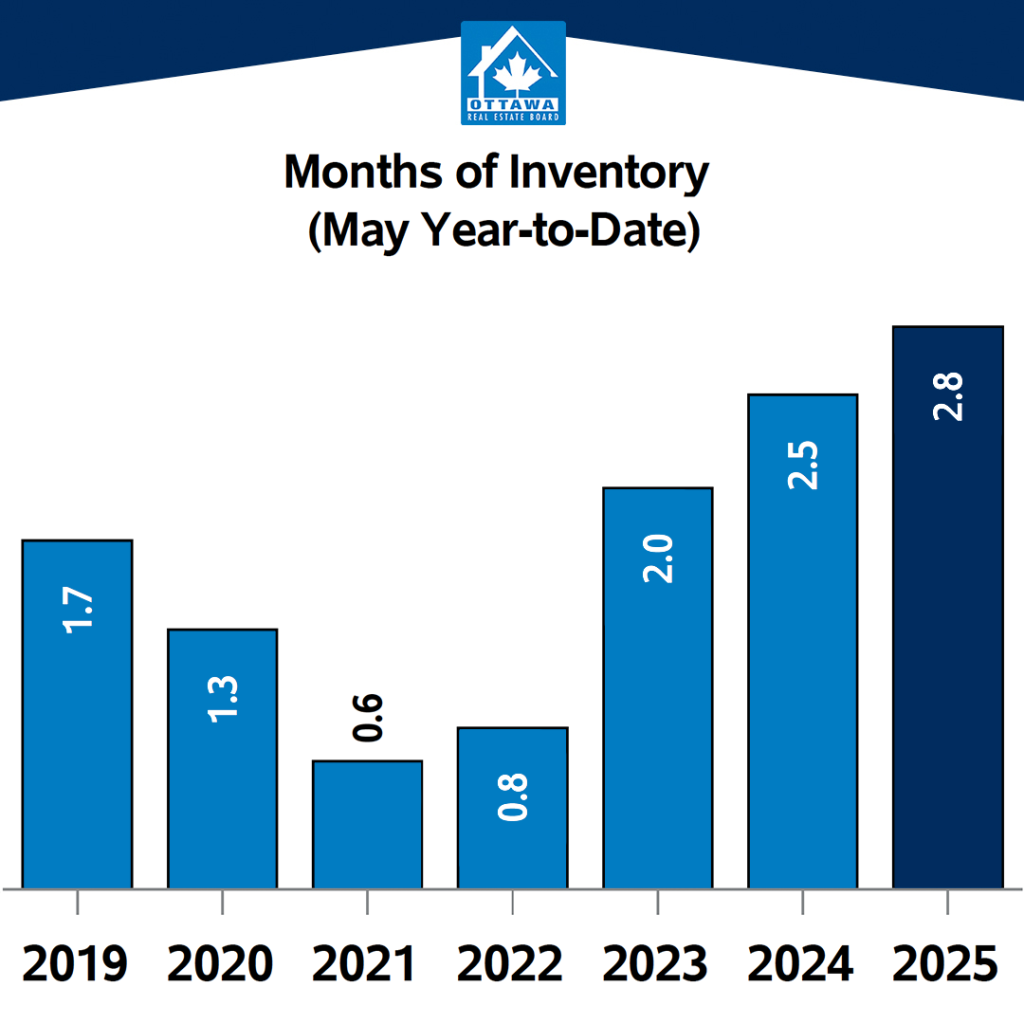
- Months of inventory remained steady at 2.4 in May 2025, unchanged from the same period last year. The number of months of inventory is the number of months it would take to sell current inventories at the current rate of sales activity.
*Due to the transition to PropTx, OREB is momentarily unable to provide the 10-year average.
**In its classification system, the Canadian Real Estate Association (CREA) identifies townhouses under the subtypes “Att Row Townhouse” and “Condo Townhouse.”