Balanced but Softening: Ottawa Housing Market Shifts Toward Higher Supply
December 9, 2025
Ottawa eased into a slower market rhythm in November, shaped by early winter weather and a cautious economic environment. Sales declined from October and fell below November 2024 levels. Although active listings dipped month over month, months of inventory (MOI) rose again after tightening earlier in the fall. The market remained broadly balanced, but the data shows a tilt toward higher supply, with November’s seasonal slowdown more pronounced than usual.
Recent rate cuts offer some optimism for renewed buyer engagement through the typically quiet winter months, setting the stage for a steadier start to the new year and a more energized spring. At the same time, elevated inventory in the townhome and apartment segments warrants ongoing attention to ensure clients understand the current dynamics.
November Snapshot: Home Sales in Ottawa
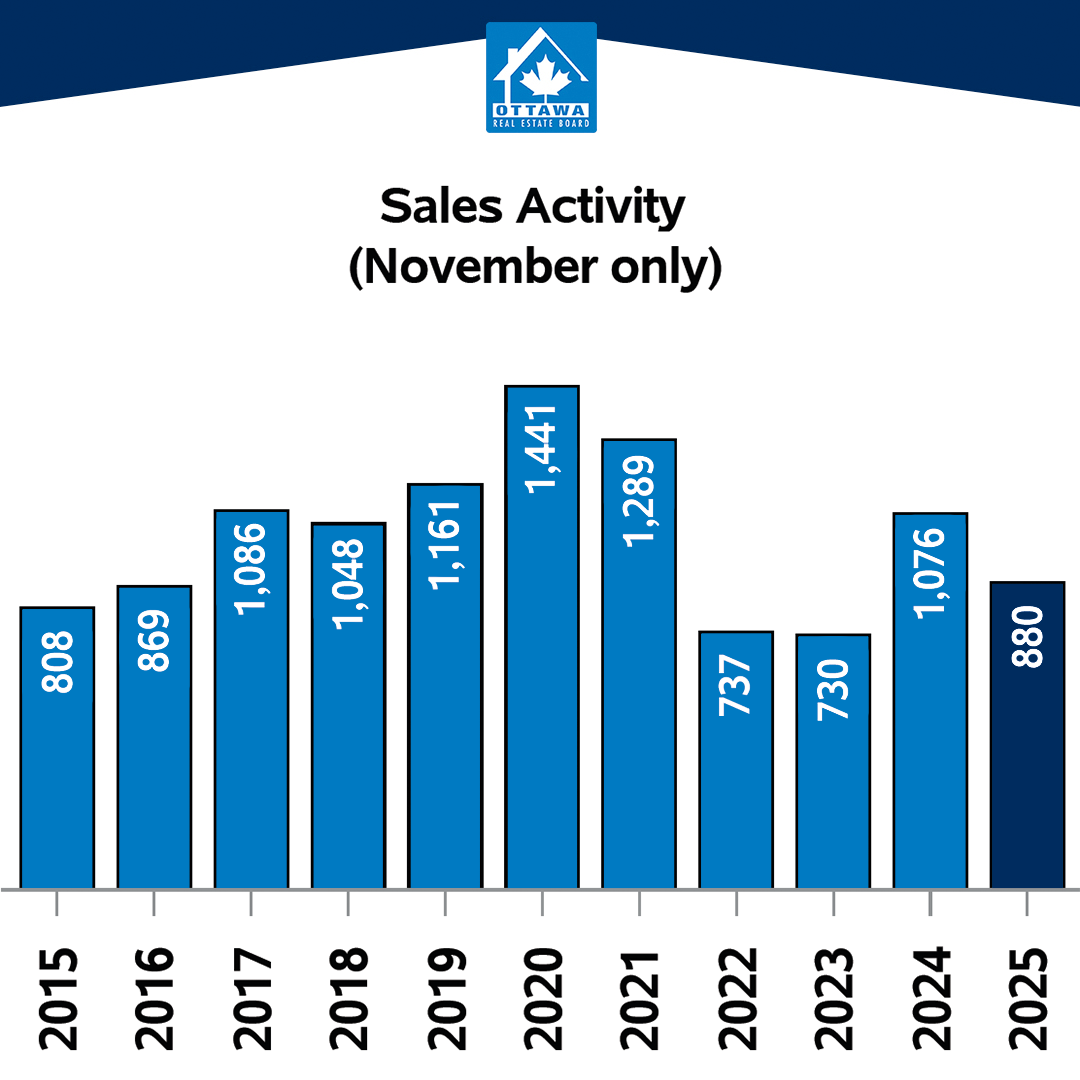
- November total sales: 880, down from 1,177 in October 2025
- 18.2 per cent lower than November 2024
- Year-to-date sales remain 1.5 per cent ahead of this point in 2024
- Average sale price: $680,496, up a little more than 2 per cent year over year
- Year-to-date average: near $700,000, 3 per cent higher than a year ago
- Gains are largely driven by single-family sales, which continue to climb
- Single-family homes averaged $825,827 in November 2025, up 4.8 per cent compared with November 2024 and up 4 per cent year-to-date
Supply Continues to Build
While inventory typically climbs in November, the increase this year is more pronounced. Active listings reached 3,721, and months of inventory rose to 4.2, a meaningful shift from last year’s tighter conditions. That additional choice is influencing pricing and buyer behaviour across property types. Townhomes averaged $542,607 in November, down from both October and last year’s year-to-date figures. Apartments face the most supply pressure: condo MOI climbed above seven and sales were down by more than a third year over year. Prices in this segment have held up better than townhomes on an annual basis, but the volume of available product signals a softer environment than the stable average sale price suggests.
Ottawa’s apartment market is particularly important to watch in light of Toronto’s experience. Toronto is working through one of the most significant buildups of condo inventory in recent memory, putting clear pressure on prices. Ottawa is not in the same position, but the increase in apartment inventory is real. REALTORS® will want to monitor this segment closely through the winter, especially if listings continue to rise faster than sales. Nearly 70 per cent of new home starts this year are concentrated in rental and condo projects, creating a substantial pipeline of multi-unit supply coming online in the coming years. While these starts influence the long-term rather than the immediate picture, they remain a key factor to watch. Toronto’s condo supply challenges emerged over several years as resale listings accumulated alongside an influx of new completions.
Residential Market Activity: Big Picture
- Total 2025 home sales to date: 13,075
- Increase in home sales compared with 2024: 1.5 per cent
- Average sale price in November: $680,496
- Increase in sale price from 2024: 2.2 per cent, down more than 4 per cent from October*
- Year-to-date average home price: $699,635, a 3.0 per cent increase over the first 11 months of 2024
- Total value of homes sold in November: $599 million (16.5 per cent decrease year over year)
- Year-to-date sales: more than $9 billion, a 4.6 per cent increase over 2024
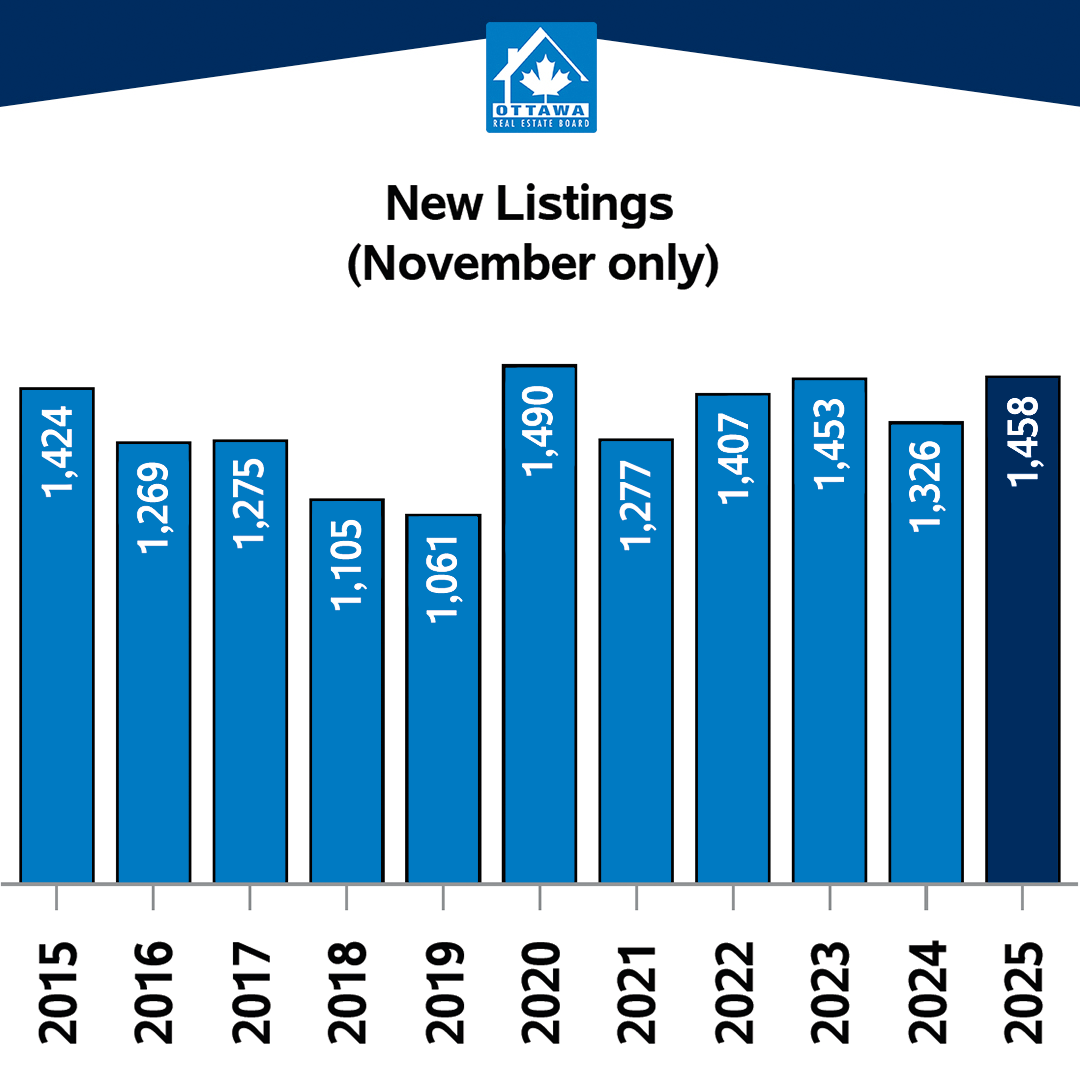
- New residential listings in November: 1,458, down 39 per cent from October but 10 per cent higher than November 2024
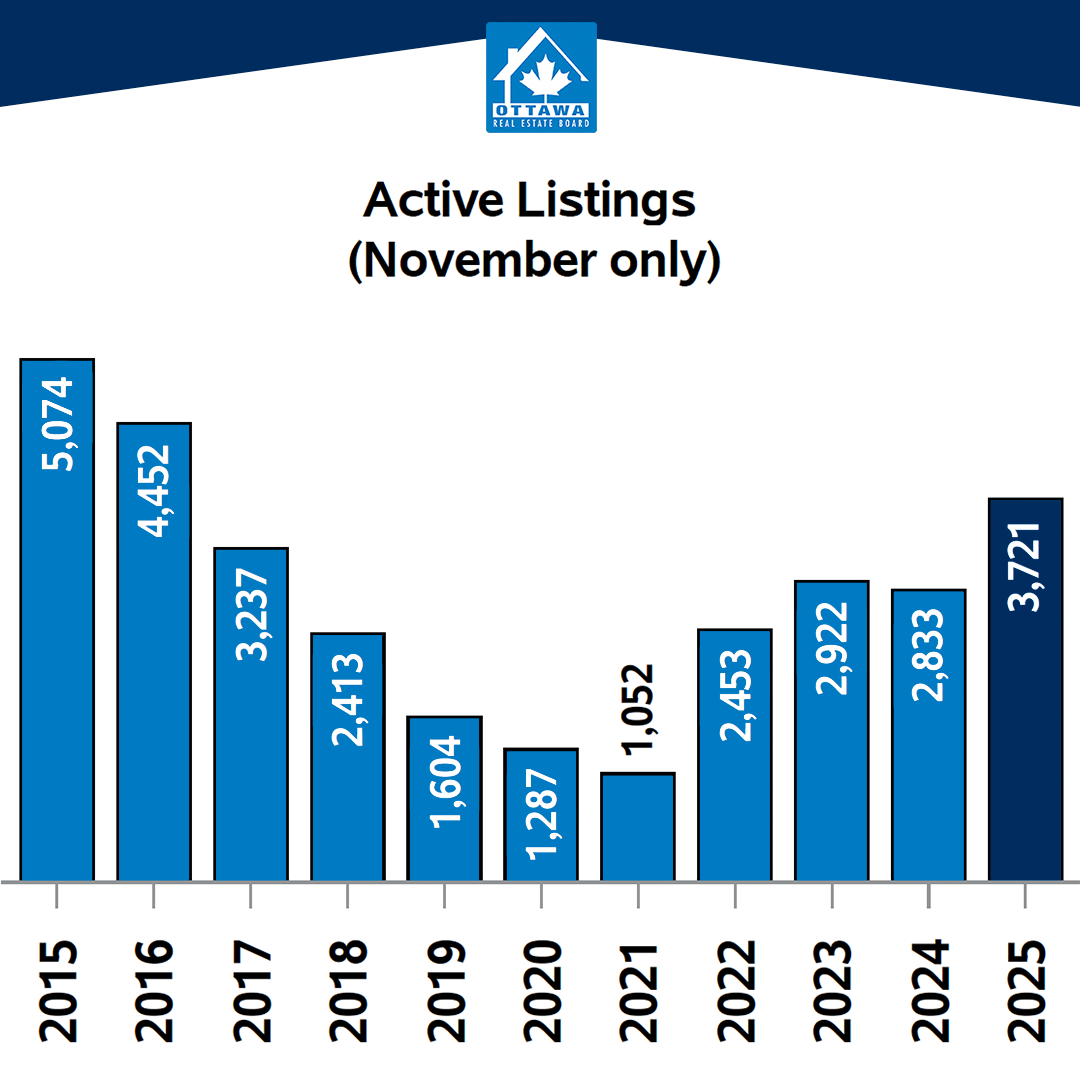
- November active listings: 3,721, a 12 per cent decrease from October but 31.3 per cent higher than 2024
*Prices typically decrease from October to November. A 4 per cent drop is notable as it is larger than usual.
This active listing indicator is trending higher than each of the past five years, indicating this is more than the cyclical supply buildup associated with late fall and early winter.
Months of inventory (MOI), a key measure of supply, rose overall from 3.6 in October to 4.2, reflecting what remains a generally balanced market. Though it is worth noting that the disparity in MOI between property types.
Months of Inventory
- Single-family: 4.0
- Townhome: 3.1
- Apartment: 7.3
OREB is working to resolve a discrepancy in the November HPI data. It will be distributed as soon as possible.