Momentum Builds in Ottawa’s Housing Market Amid Greater Certainty
May 6, 2025
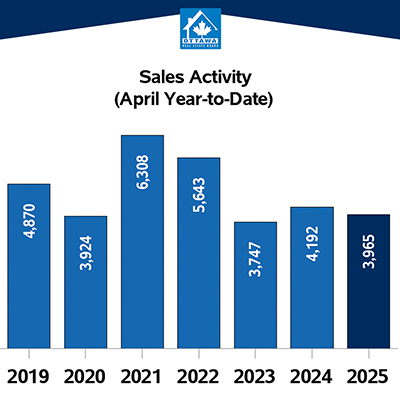
The number of homes sold through the MLS® System of the Ottawa Real Estate Board (OREB) totaled 1,306 units in April 2025. This represented an 18.4% increase from March 2025, but an 11.2% decline from April 2024.
Home sales were 17.6% below the five-year average and 16.2% below the 10-year average for the month of April.
“While April sales were down year-over-year, we saw a healthy month-over-month increase—an encouraging sign of growing momentum as we move through the spring market,” says OREB President Paul Czan. “Inventory remains at higher levels compared to previous years, indicating a gradual move towards a balanced market.”
“With more certainty following the federal election, buyers are returning with greater confidence—but they’re proceeding cautiously, taking their time, including conditions in their offers, and being more selective,” adds Czan. “Sellers, meanwhile, are adjusting to longer days on market, which makes strategic pricing and thoughtful home preparation more important than ever. If the listing is priced well, shows well, it’s moving—possibly getting multiple offers. Looking ahead, we’ll be watching how the federal government’s recent housing commitments translate into action. Policies aimed at increasing supply, improving affordability, and supporting first-time buyers are welcome steps toward meaningful impact here in Ottawa.”
By the Numbers – Prices:
- The overall MLS® HPI composite benchmark price was $631,200 in April 2025, a 1.1% rise compared to April 2024.
- The benchmark price for single-family homes was $703,200, up 1.0% year-over-year in April.
- By comparison, the benchmark price for a townhouse/row unit was $440,000, an increase of 4.4% from 2024.
- The benchmark apartment price was $404,000, a 2.8% decline from the previous year.
- The average price of homes sold in April 2025 was $707,180, a 0.4% increase from April 2024.
- The total dollar volume of all home sales in April 2025 amounted to $923.5 million, a 10.8% drop compared to the same period last year.
OREB cautions that the average sale price can be useful in establishing trends over time but should not be used as an indicator that specific properties have increased or decreased in value. The calculation of the average sale price is based on the total dollar volume of all properties sold. Prices will vary from neighbourhood to neighbourhood.
By the Numbers – Inventory & New Listings:
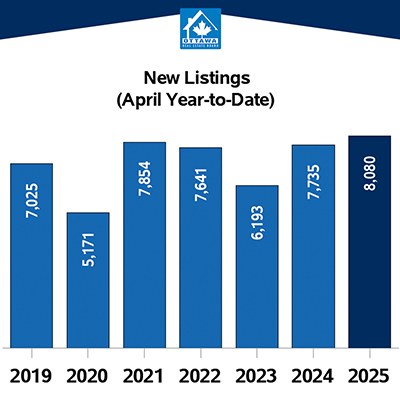
- The number of new listings declined by 3.8% compared to April 2024, with 2,589 new residential properties added to the market. New listings were 2.8% above the five-year average and 5.6% above the 10-year average for the month of April.
- Active residential listings totaled 3,834 units at the end of April 2025, reflecting a 21.4% surge from April 2024. Active listings were 86.9% above the five-year average and 51.3% above the 10-year average for the month of April.
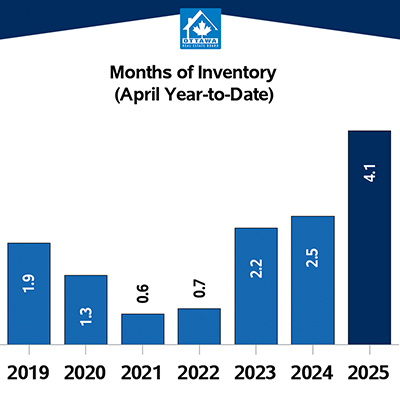
- Months of inventory stood at 2.8 at the end of April 2025, compared to 2.1 in April 2024. The number of months of inventory is the number of months it would take to sell current inventories at the current rate of sales activity.
OREB has corrected its April 2025 housing market statistics to reflect accurate Active Listings and Months of Inventory after identifying and resolving duplicate entries introduced during the PropTx MLS® platform transition.