The Ottawa Real Estate Board (OREB) commends the Government of Ontario for its $9.5 million investment to develop more than 100 supportive housing units in Ottawa.
The Ottawa Real Estate Board (OREB) commends the Government of Ontario for its $9.5 million investment to develop more than 100 supportive housing units in Ottawa. At a time when our city is grappling with a housing and homelessness emergency, this funding will build the right kind of homes for people who need them the most. OREB and its Member REALTORS® are committed to advocating for a diverse range of affordable and suitable housing options to meet the varying needs of our community because everyone in Ottawa deserves a place to call home.
Ottawa was the first city in Canada to declare a housing and homelessness emergency. Despite chronic affordability and supply issues, Ottawa’s city council is proposing an ill-timed and counterproductive increase in development charges.
The Ottawa Real Estate Board (OREB) strongly opposes the proposed increase and wants the city to reconsider a move that threatens to worsen the challenges facing prospective homebuyers. The ramifications of a cost increase will also be felt beyond the broader housing market in our community when businesses and services cannot adequately attract and retain staff due to a lack of housing.
Raising development charges will significantly increase the cost of new homes. These charges, intended to fund essential infrastructure like roads, water, and wastewater services, already add a substantial financial burden to new developments. Further hikes will lead to higher home prices and slow the construction of new homes — ultimately making homeownership less attainable for many Ottawa residents.
At a time when we should be expanding the housing supply and enhancing affordability, this proposal moves us in the opposite direction. It risks deepening the housing crisis, putting additional financial strain on families and individuals striving to buy their first home. It runs counter to the federal and provincial governments’ efforts to address housing issues through new funding initiatives that do not rely on increasing costs for consumers.
OREB recommends implementing more effective and equitable solutions to funding essential infrastructure without hindering housing development, including:
Capitalizing on federal and provincial funding programs designed to support municipal infrastructure projects without passing costs onto homebuyers.
Allowing water and wastewater services to be provided by municipal services corporations.
Changing city-wide policies to end exclusionary zoning, thereby allowing more diverse and affordable housing options to be built.
Encouraging higher density developments along transit corridors to maximize the use of existing infrastructure.
Helping switch underused commercial properties into residential spaces, increasing the housing supply without new land development.
OREB and its 4,000 member REALTORS® have insights and innovative solutions that promote housing affordability and supply and are committed to working with Ottawa’s city council, policy makers and housing partners to help more residents secure suitable housing.
The number of homes sold through the MLS® System of the Ottawa Real Estate Board (OREB) totaled 1,456 units in April 2024. This was an increase of 8.9% from April 2023.
Home sales were 2% below the five-year average and 6.9% below the 10-year average for the month of April.
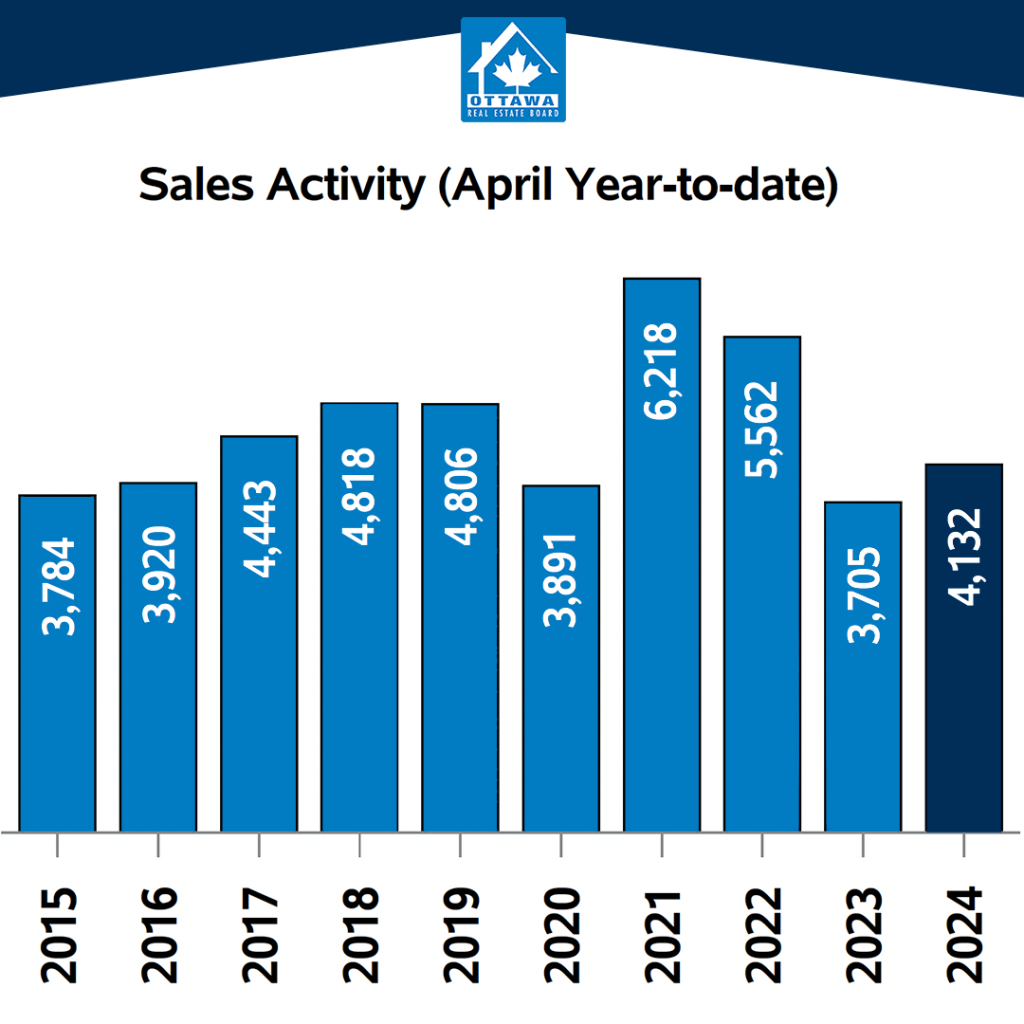
On a year-to-date basis, home sales totaled 4,132 units over the first four months of the year — an increase of 11.5% from the same period in 2023.
“It’s a typical spring in Ottawa’s real estate market,” says OREB President Curtis Fillier. “What sets it apart from recent springs is a restored mutual confidence among both buyers and sellers. Buoyed by recent sales activity, sellers are more confident that they can move their property as evidenced by the uptick in listings. For buyers, the pressure of the pandemic market has eased and they’re comfortable taking the time to find the property that best suits their needs. The pace is still conservative while the economy is holding some back, but overall Ottawa’s market is strong and stable, and that’s a win-win.”
“The real story is in the details,” says Fillier. “Looking more closely at what’s selling and for how much suggests the demographic of buyer is changing. While most of Ottawa’s market is in balanced territory, townhomes have shifted to the seller’s market side as supply shrinks. Single-family homes are the most active market, which is inflating the average sale price. The next few months will be both telling and interesting as people continue to redefine their post-pandemic normal amid an upcoming federal election and back-to-work mandate for government workers. The detailed insights and data that REALTORS® have unique access to will be invaluable in helping buyers fine-tune their strategy for their specific neighbourhood and property type.”
By the Numbers – Prices: The MLS® Home Price Index (HPI) tracks price trends far more accurately than is possible using average or median price measures.
The overall MLS® HPI composite benchmark price was $643,700 in April 2024, a marginal gain of 1.6% from April 2023.
The benchmark price for single-family homes was $727,700, up 1.6% on a year-over-year basis in April.
By comparison, the benchmark price for a townhouse/row unit was $500,800, up slightly at 1% compared to a year earlier.
The benchmark apartment price was $423,100, up 2.1% from year-ago levels.
The average price of homes sold in April 2024 was $705,117 increasing 1.2% from April 2023. The more comprehensive year-to-date average price was $675,817, increasing by 2.4% from the first four months of 2023.
• The dollar volume of all home sales in April 2024 was $1.02 billion, up 10.2% from the same month in 2023.
OREB cautions that the average sale price can be useful in establishing trends over time but should not be used as an indicator that specific properties have increased or decreased in value. The calculation of the average sale price is based on the total dollar volume of all properties sold. Prices will vary from neighbourhood to neighbourhood.
By the Numbers – Inventory & New Listings
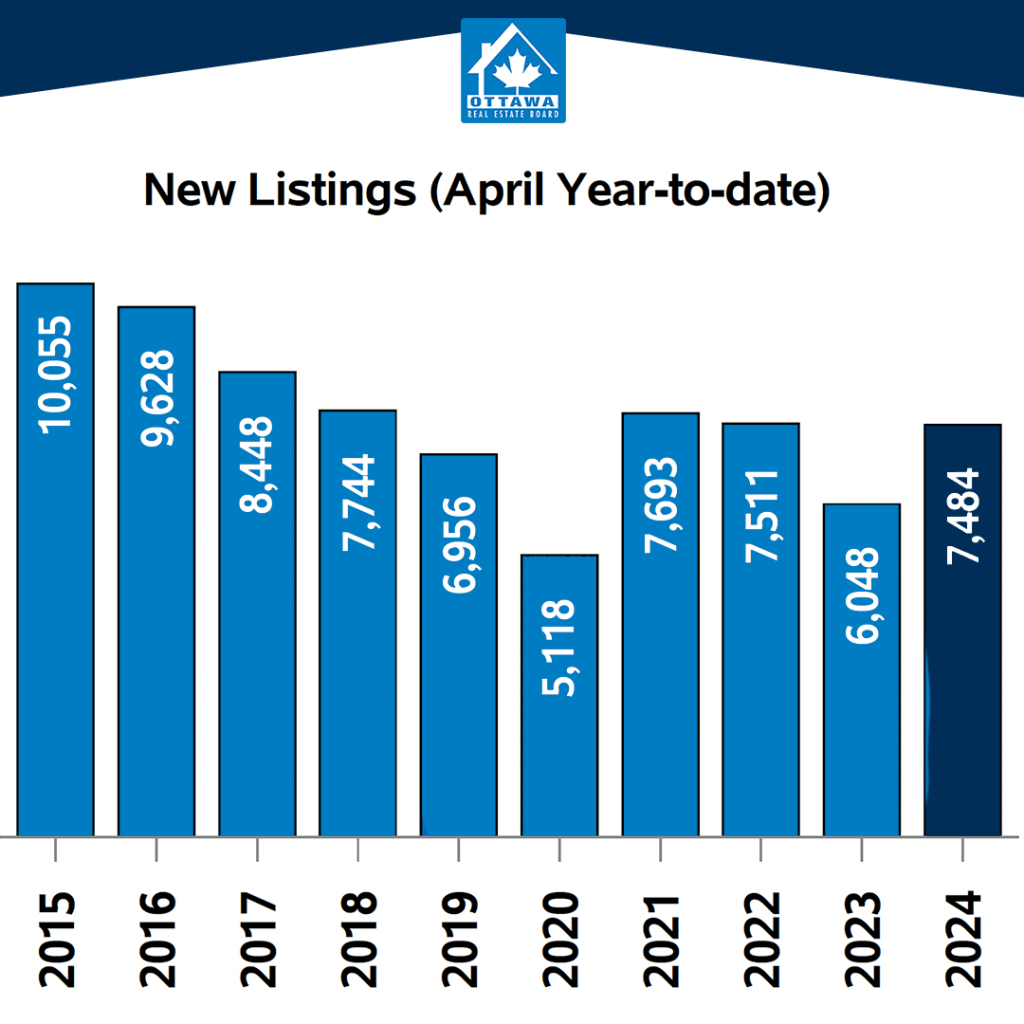
The number of new listings saw an increase of 40.5% from April 2023. There were 2,597 new residential listings in April 2024. New listings were 19.7% above the five-year average and 4.6% above the 10-year average for the month of April.
Active residential listings numbered 2,966 units on the market at the end of April 2024, a gain of 36.6% from April 2023. Active listings were 62.6% above the five-year average and 13.7% below the 10-year average for the month of April.
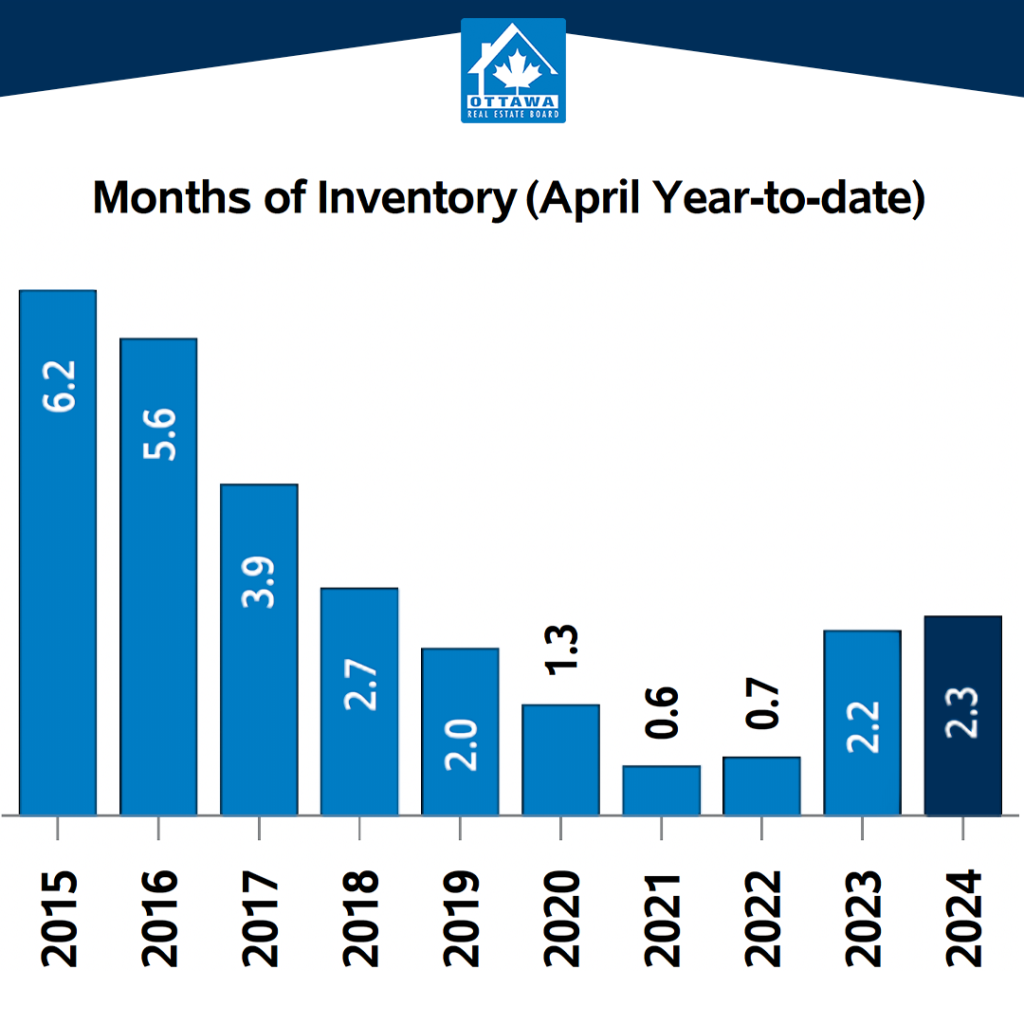
Months of inventory numbered 2 at the end of April 2024, up only slightly from 1.6 in April 2023. The number of months of inventory is the number of months it would take to sell current inventories at the current rate of sales activity.