The number of homes sold through the MLS® System of the Ottawa Real Estate Board totaled 816 units in October 2023. This was a small reduction of 2.7% from October 2022.
Home sales were 36.4% below the five-year average and 30.8% below the 10-year average for the month of October.
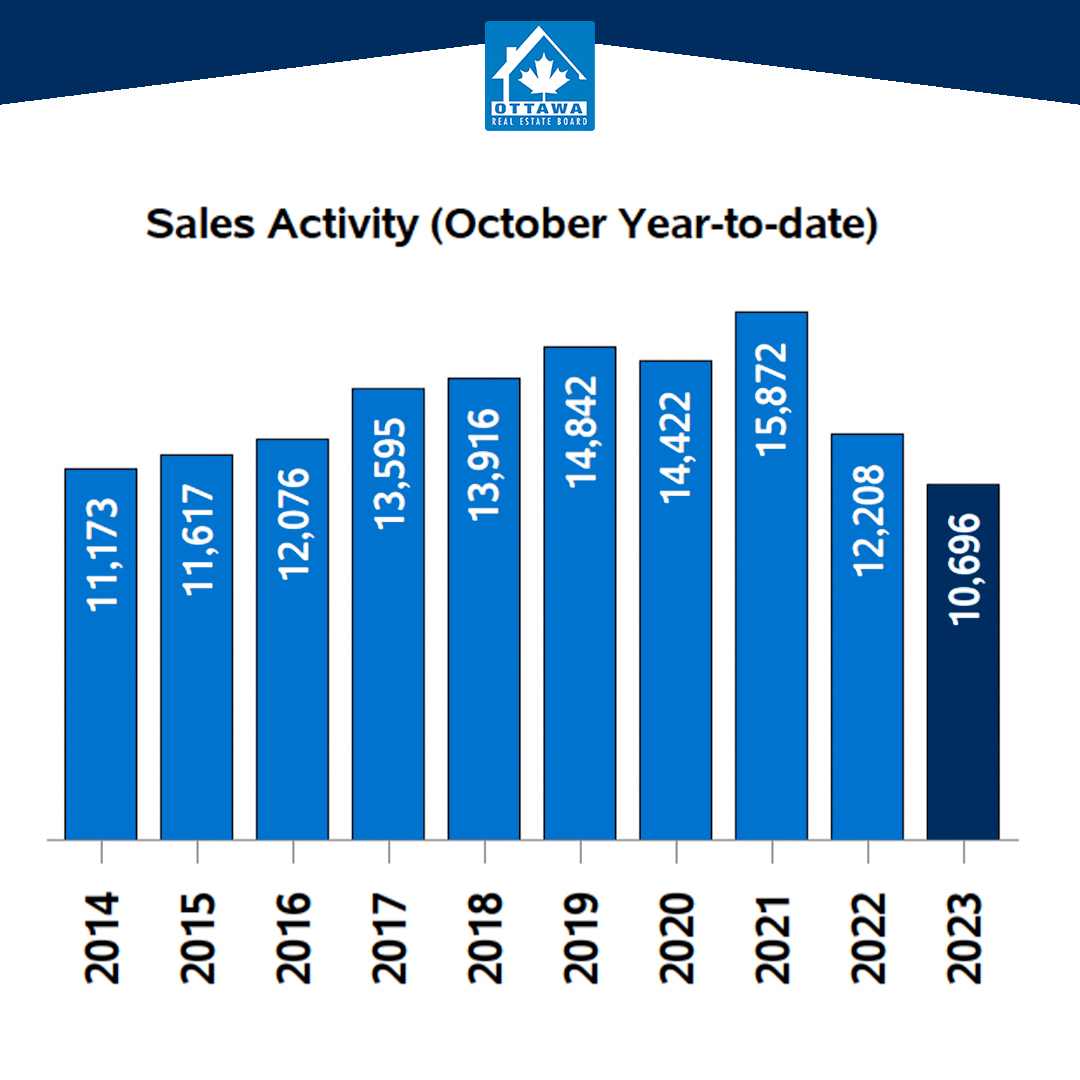
On a year-to-date basis, home sales totaled 10,700 units over the first 10 months of the year. This was a substantial decline of 12.3% from the same period in 2022.
“Life is expensive these days, which likely has both buyers and sellers staying put,” says Ken Dekker, OREB President. “We’re seeing a slow decline in sales activity but it’s minimal and not unexpected for this time of year. Prices are adjusting and coming down, which is also indicative of the types of homes that are selling — apartments seeing the largest increase in sales activity over last October. While Ottawa’s inventory is slowly building, chronic supply issues mean there’s always an undercurrent of demand. Don’t let the lull fool you: now is a prime time for buyers to be looking for opportunities before the current carries us from a balanced market into seller’s territory.”
By the Numbers – Prices:
The MLS® Home Price Index (HPI) tracks price trends far more accurately than is possible using average or median price measures.
- The overall MLS® HPI composite benchmark price was $638,600 in October 2023, nearly unchanged, up only 1.8% from October 2022.
- The benchmark price for single-family homes was $721,600, up 2.2% on a year-over-year basis in September.
- By comparison, the benchmark price for a townhouse was $501,100, nearly unchanged, up 1% compared to a year earlier.
- The benchmark apartment price was $424,100, unchanged from year-ago levels.
- The average price of homes sold in October 2023 was $660,836, increasing 2.9% from October 2022. The more comprehensive year-to-date average price was $671,983, a decline of 5.9% from the first ten months of 2022.
- The dollar value of all home sales in October 2023 was $539.2 million, unchanged from the same month in 2022.
OREB cautions that the average sale price can be useful in establishing trends over time but should not be used as an indicator that specific properties have increased or decreased in value. The calculation of the average sale price is based on the total dollar volume of all properties sold. Price will vary from neighbourhood to neighbourhood.
By the Numbers – Inventory & New Listings:
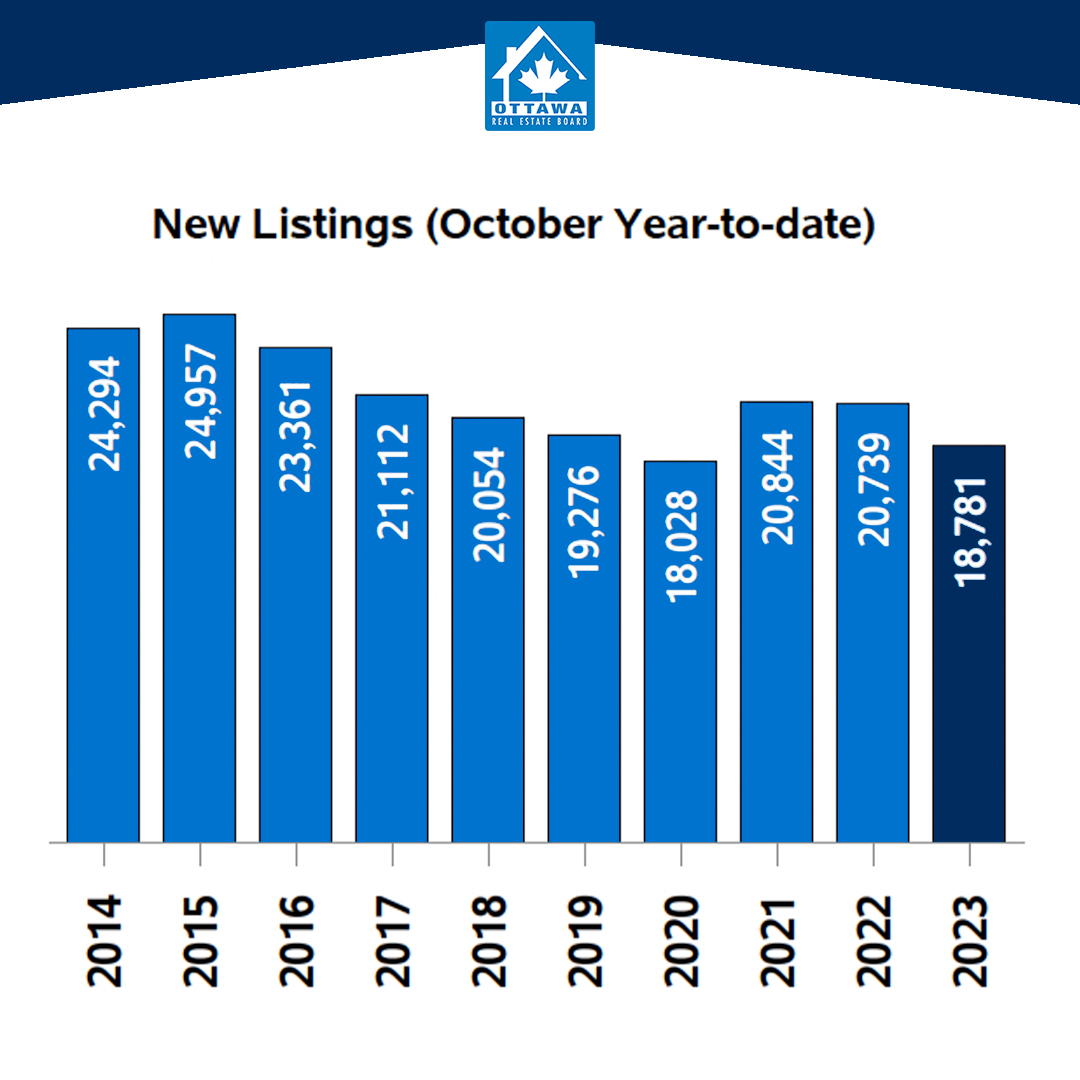
- The number of new listings saw an increase of 6.6% from October 2022. There were 1,895 new residential listings in October 2023. New listings were 2% above the five-year average and 5.4% above the 10-year average for the month of October.
- Active residential listings numbered 3,062 units on the market at the end of October, a sizable gain of 16.7% from the end of October 2022. Active listings haven’t been this high in the month of October in more than five years.
- Active listings were 43.8% above the five-year average and 10.9% below the 10-year average for the month of October.
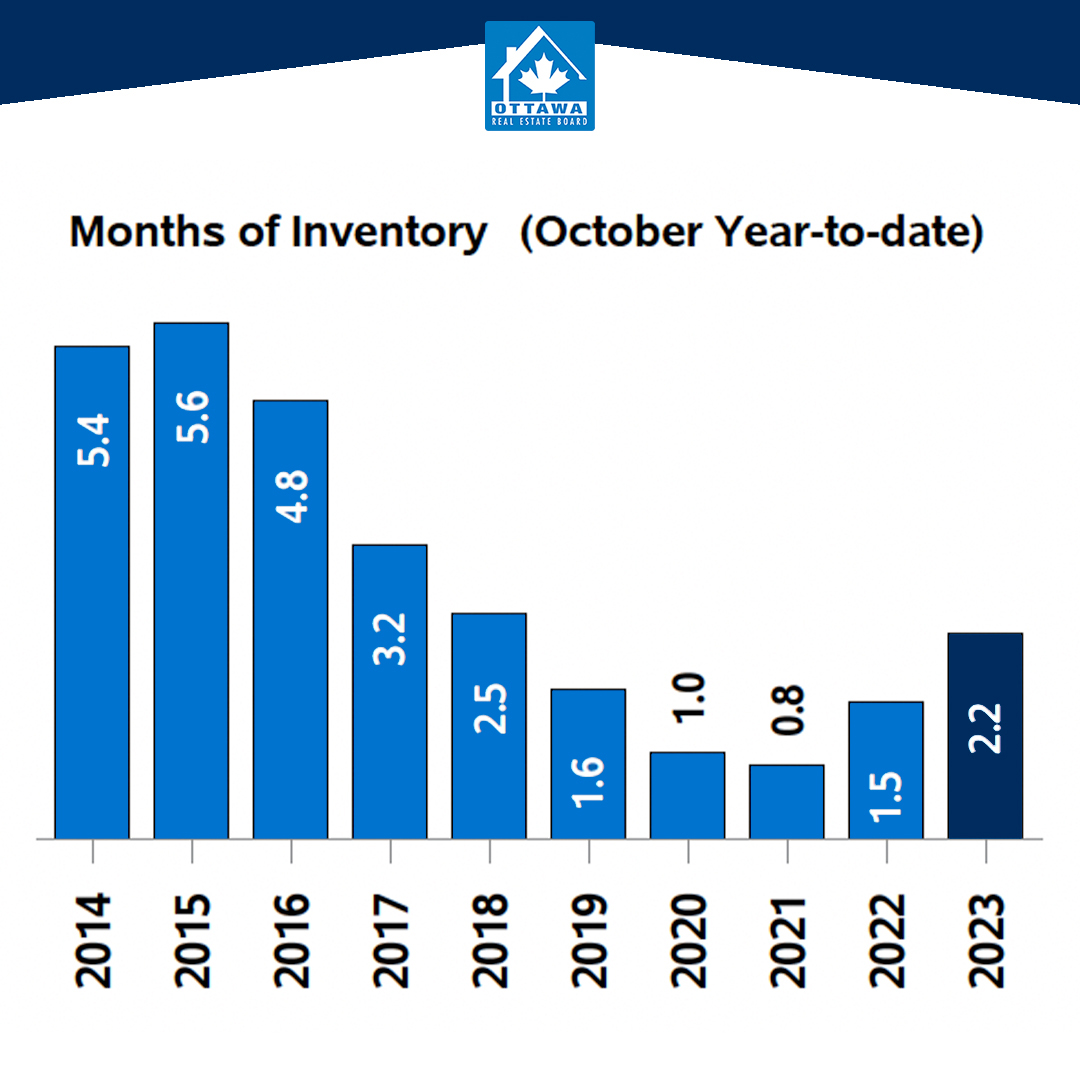
- Months of inventory numbered 3.8 at the end of October 2023, just up from the 3.1 months recorded at the end of October 2022. The number of months of inventory is the number of months it would take to sell current inventories at the current rate of sales activity.