ARCHIVE

Ottawa’s MLS® Market Activity Shows Strong Start to the Year

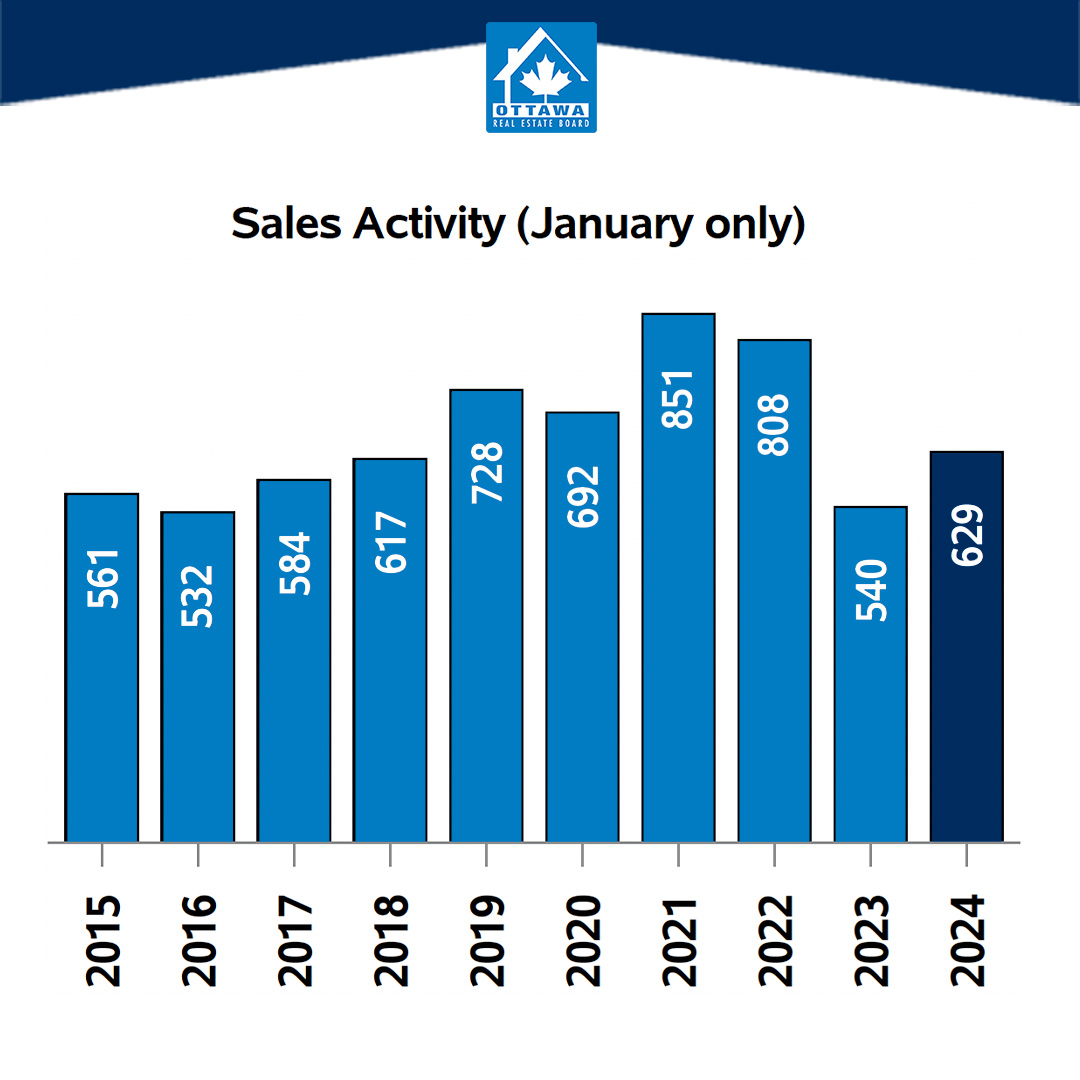
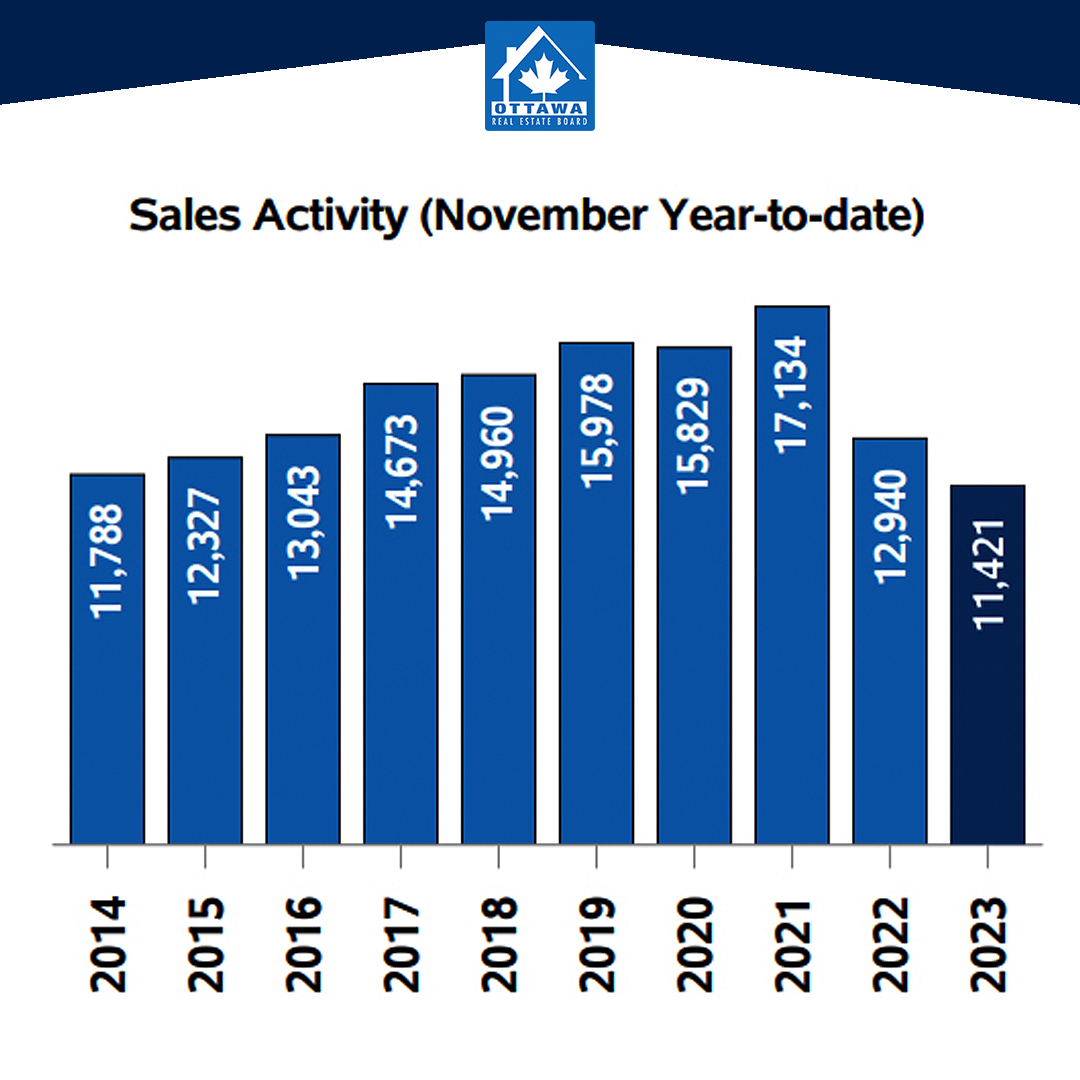
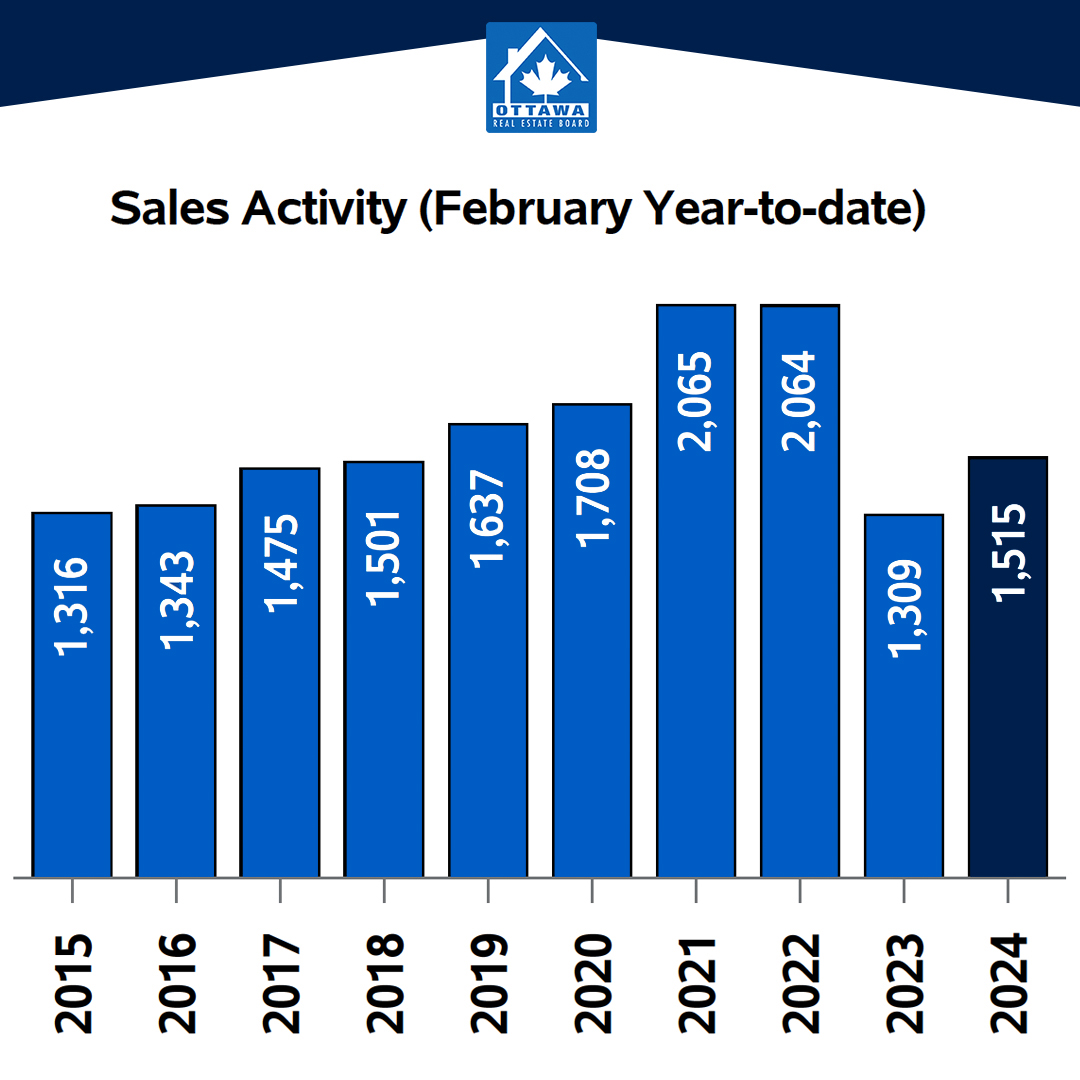
The number of homes sold through the MLS® System of the Ottawa Real Estate Board totaled 886 units in February 2024. This was an increase of 15.2% from February 2023.

Home sales were 13.8% below the five-year average and 5.7% below the 10-year average for the month of February.

“Even with higher prices and the interest rate holding steady, Ottawa is a strong, active market,” says OREB President Curtis Fillier. “With metrics across the board up from last year, it’s clear both buyers and sellers are making moves. The metrics, however, don’t tell us about all the people relegated to the sidelines because affordability remains out of reach for many.”

The Municipal Property Assessment Corporation (MPAC) recently reported that “communities with homes under $500,000 are becoming increasingly scarce.” A decade ago, 74% of Ontario residential properties had a home value estimate of less than $500,000 but that number has dropped to just 19% today.

“REALTORS® know firsthand there is persistent demand for housing in Ottawa, and our market’s activity is constrained by a lack of affordable and suitable supply,” says Fillier. “That’s why we’re currently advocating for impactful measures such as allowing four residential units on property lots and getting rid of exclusionary zoning. There’s a missing middle that we need to build up.”

By the Numbers – Prices:

The MLS® Home Price Index (HPI) tracks price trends far more accurately than is possible using average or median price measures.

  • The overall MLS® HPI composite benchmark price was $628,500 in February 2024, a gain of 2.8% from February 2023.
    • The benchmark price for single-family homes was $708,500, up 3.1% on a year-over-year basis in February.
    • By comparison, the benchmark price for a townhouse/row unit was $495,000, up slightly at 0.6% compared to a year earlier.
    • The benchmark apartment price was $417,000, up 2.7% from year-ago levels.
  • The average price of homes sold in February 2024 was $651,340, increasing 2% from February 2023.
  • The dollar volume of all home sales in February 2024 was $577 million, up 17.5% from the same month in 2023.

OREB cautions that the average sale price can be useful in establishing trends over time but should not be used as an indicator that specific properties have increased or decreased in value. The calculation of the average sale price is based on the total dollar volume of all properties sold. Prices will vary from neighbourhood to neighbourhood.

By the Numbers – Inventory & New Listings

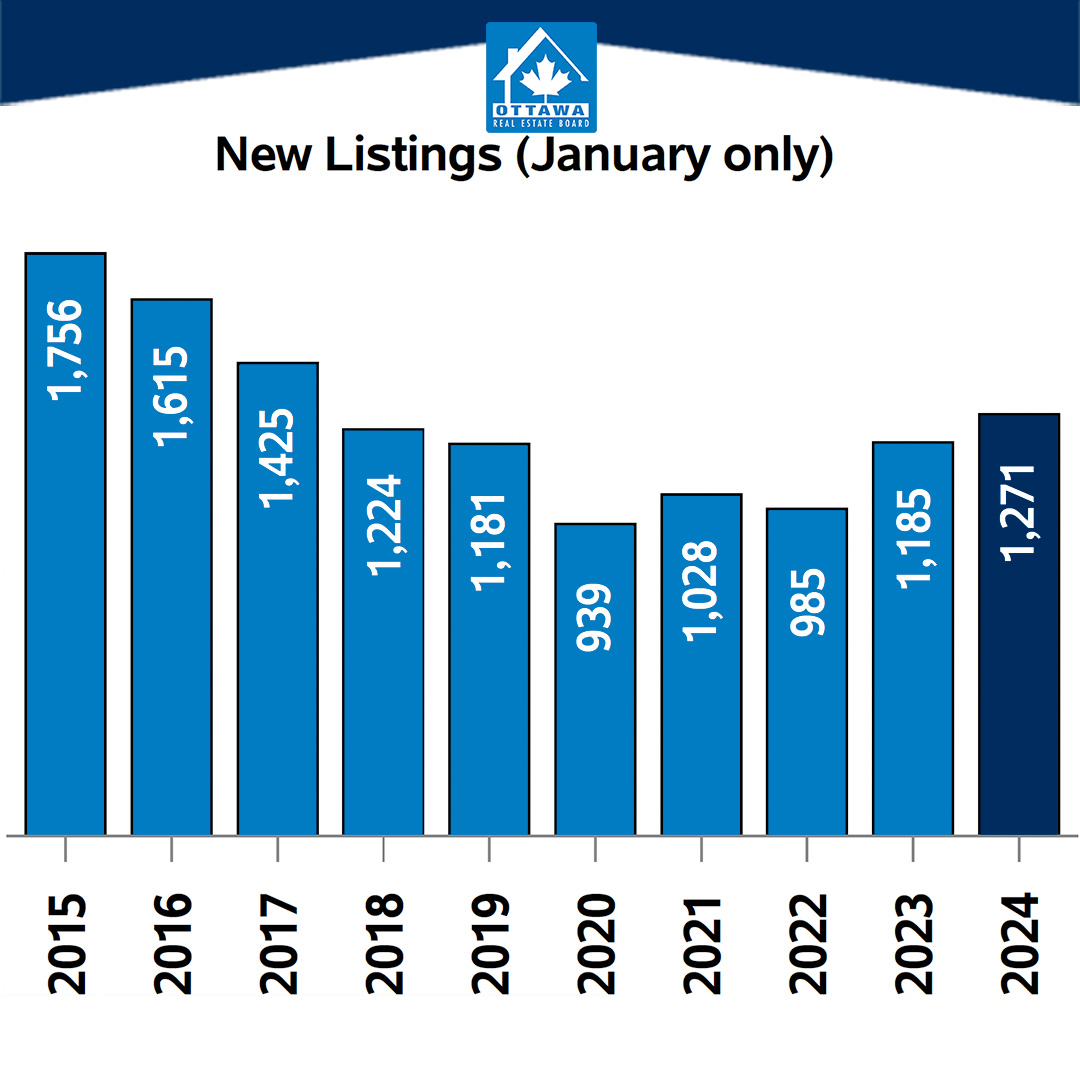
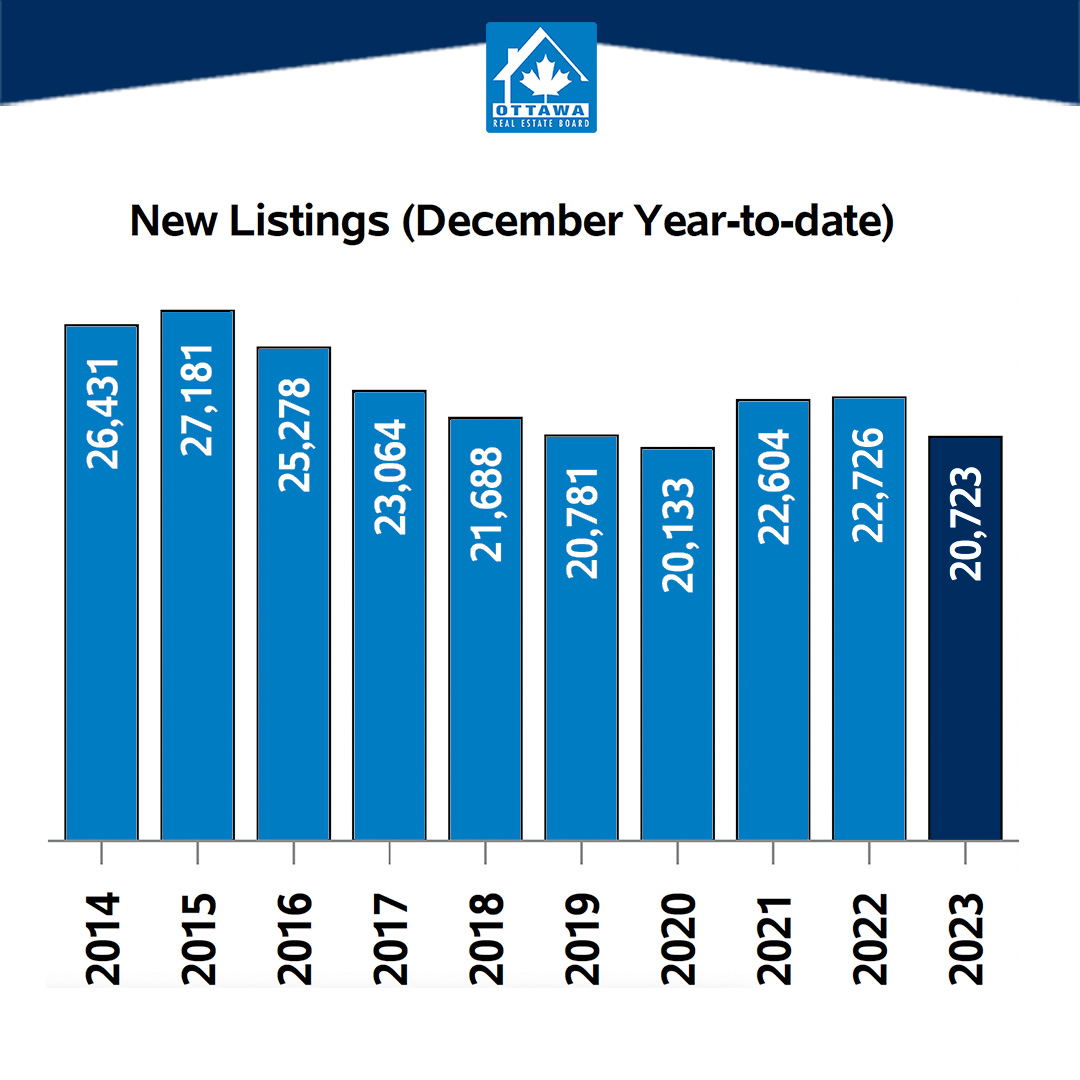
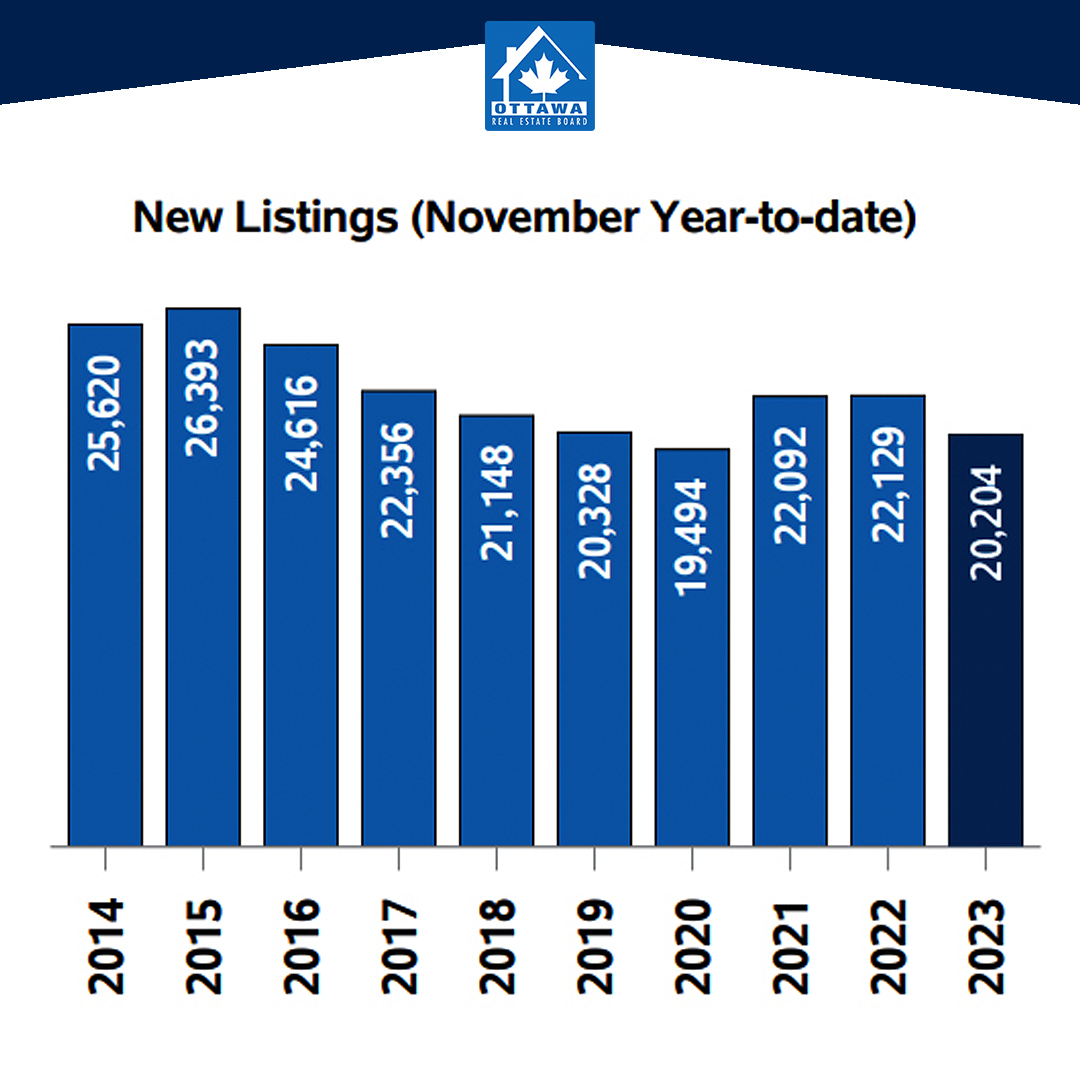
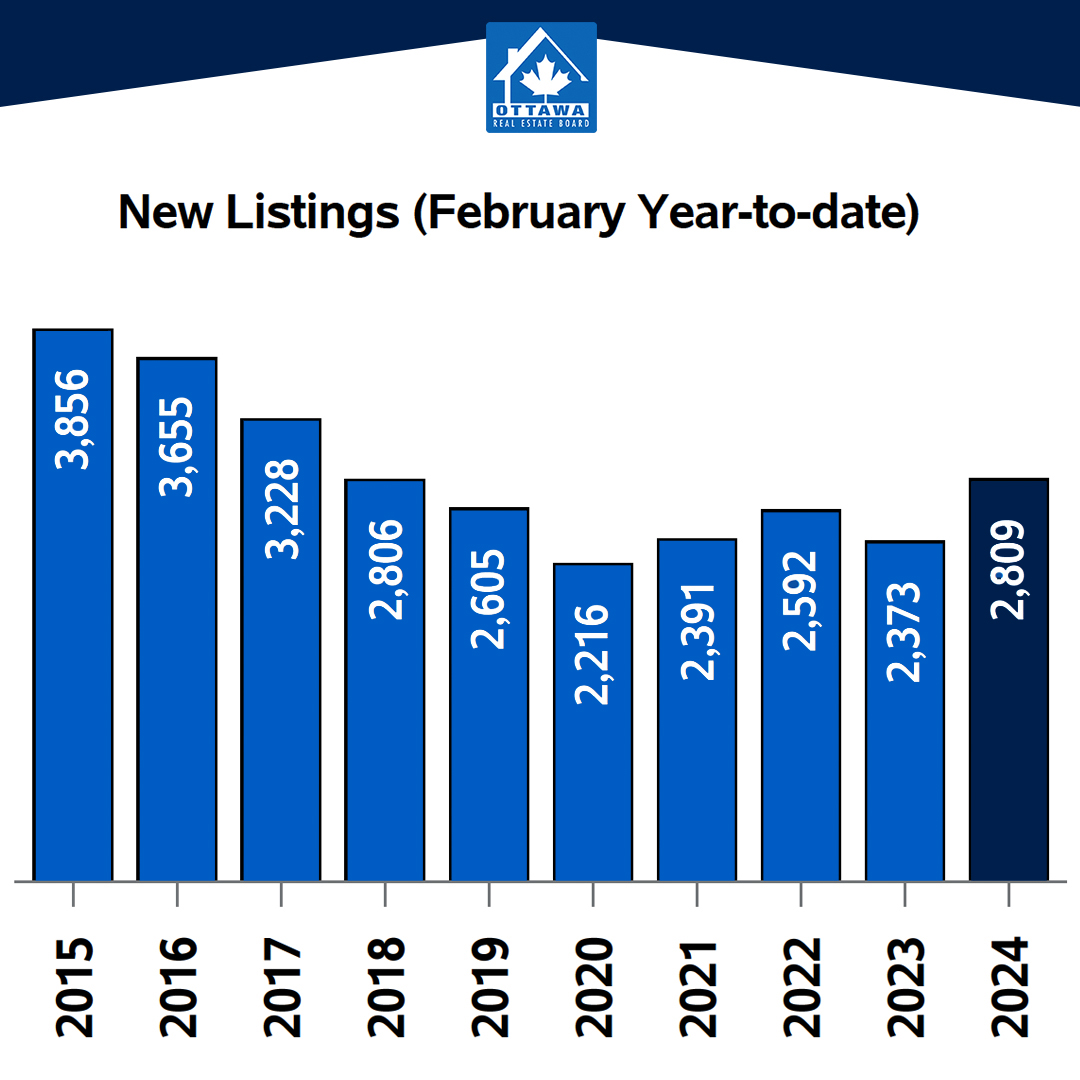
  • The number of new listings saw an increase of 29.5% from February 2023. There were 1,539 new residential listings in February 2024. New listings were 10.3% above the five-year average and 3.3% below the 10-year average for the month of February.
  • Active residential listings numbered 2,158 units on the market at the end of February 2024, a gain of 16.3% from February 2023. Active listings were 59.6% above the five-year average and 17.7% below the 10-year average for the month of February.
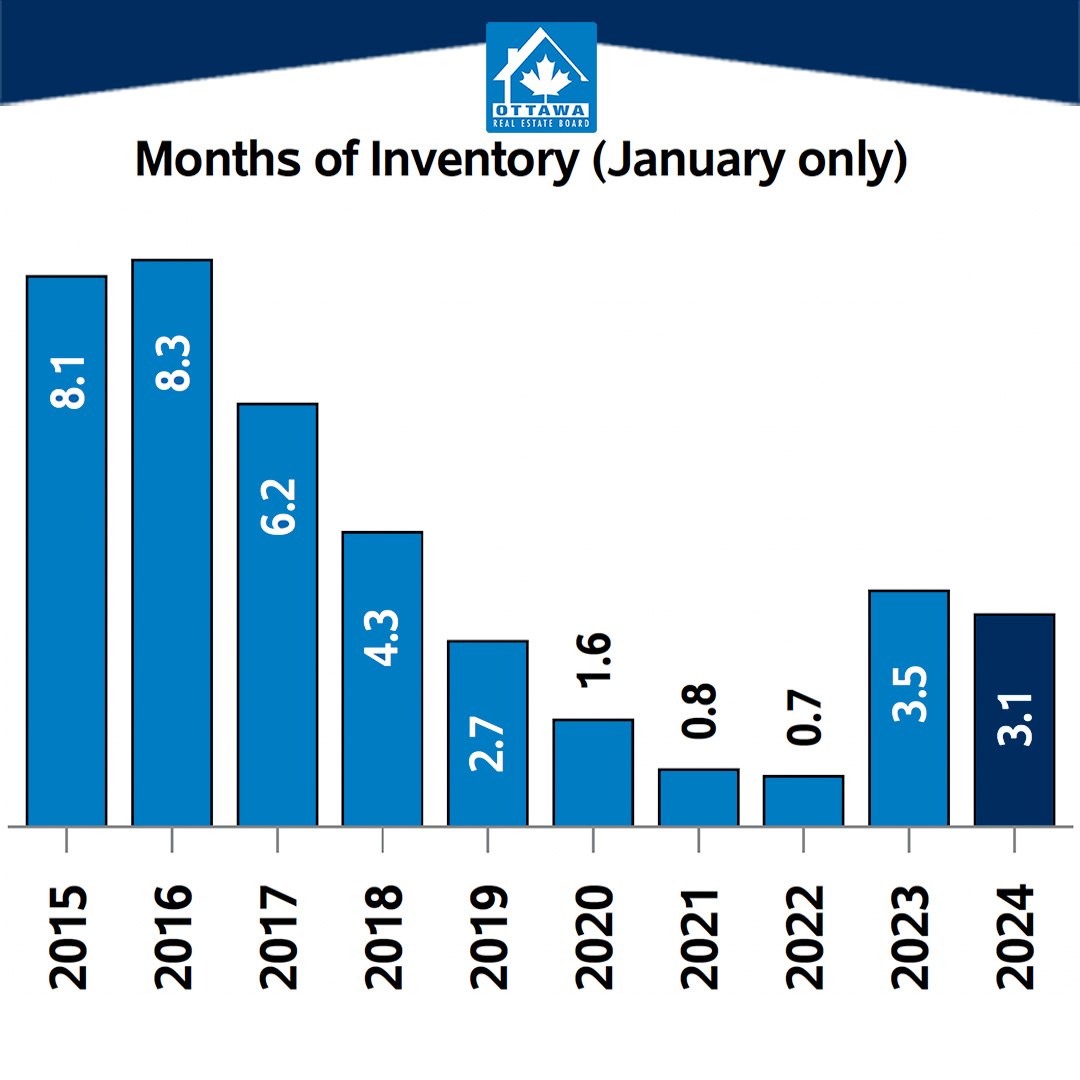
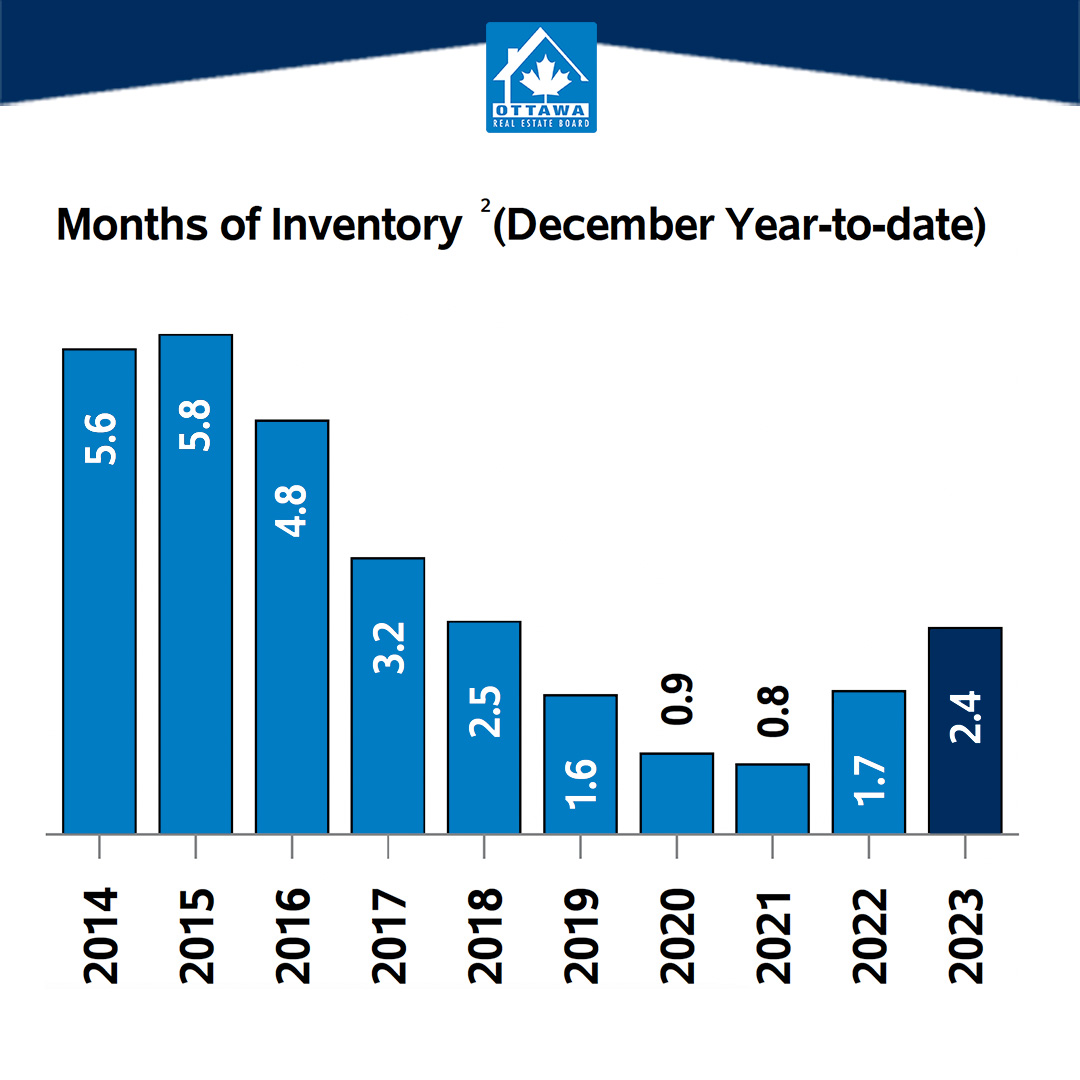
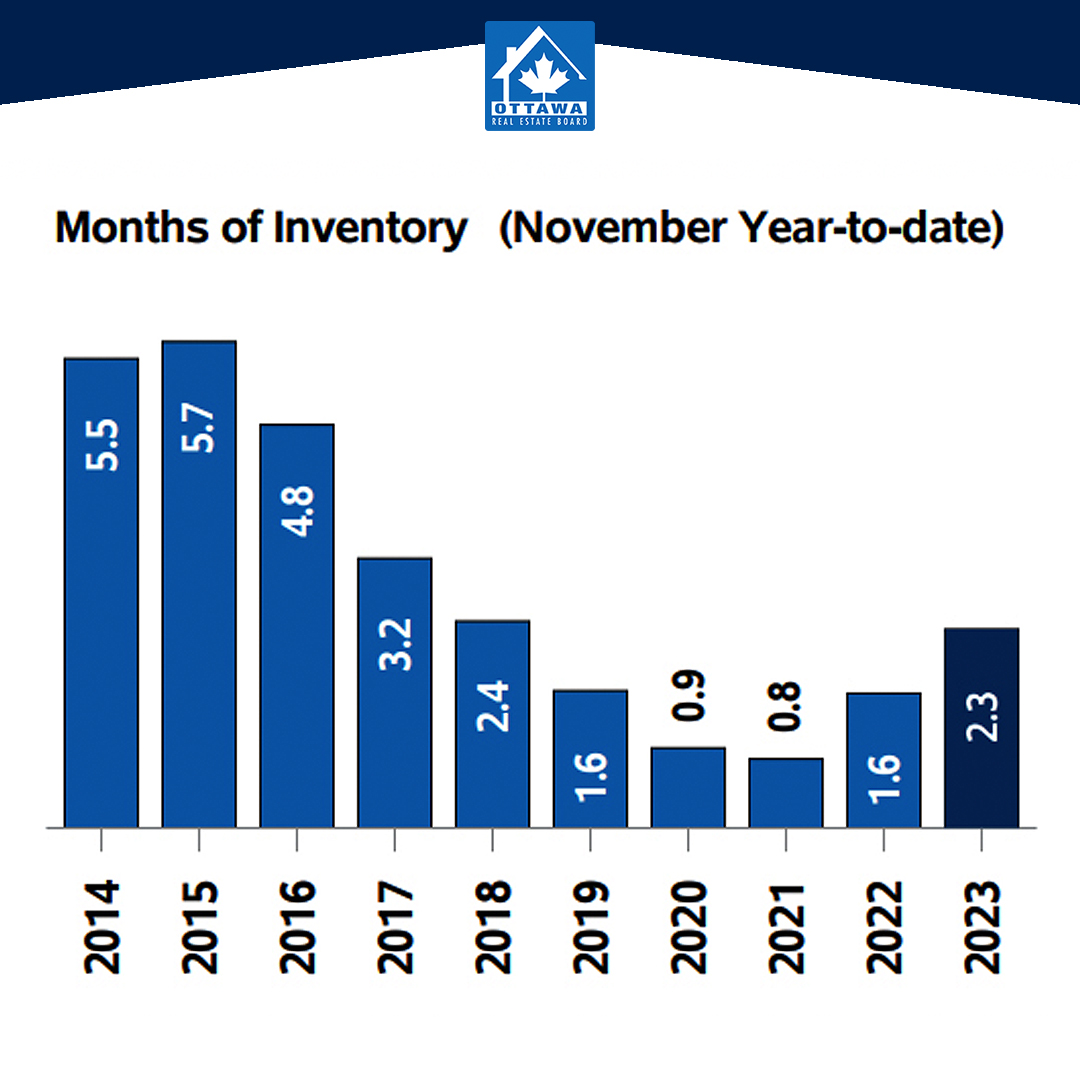
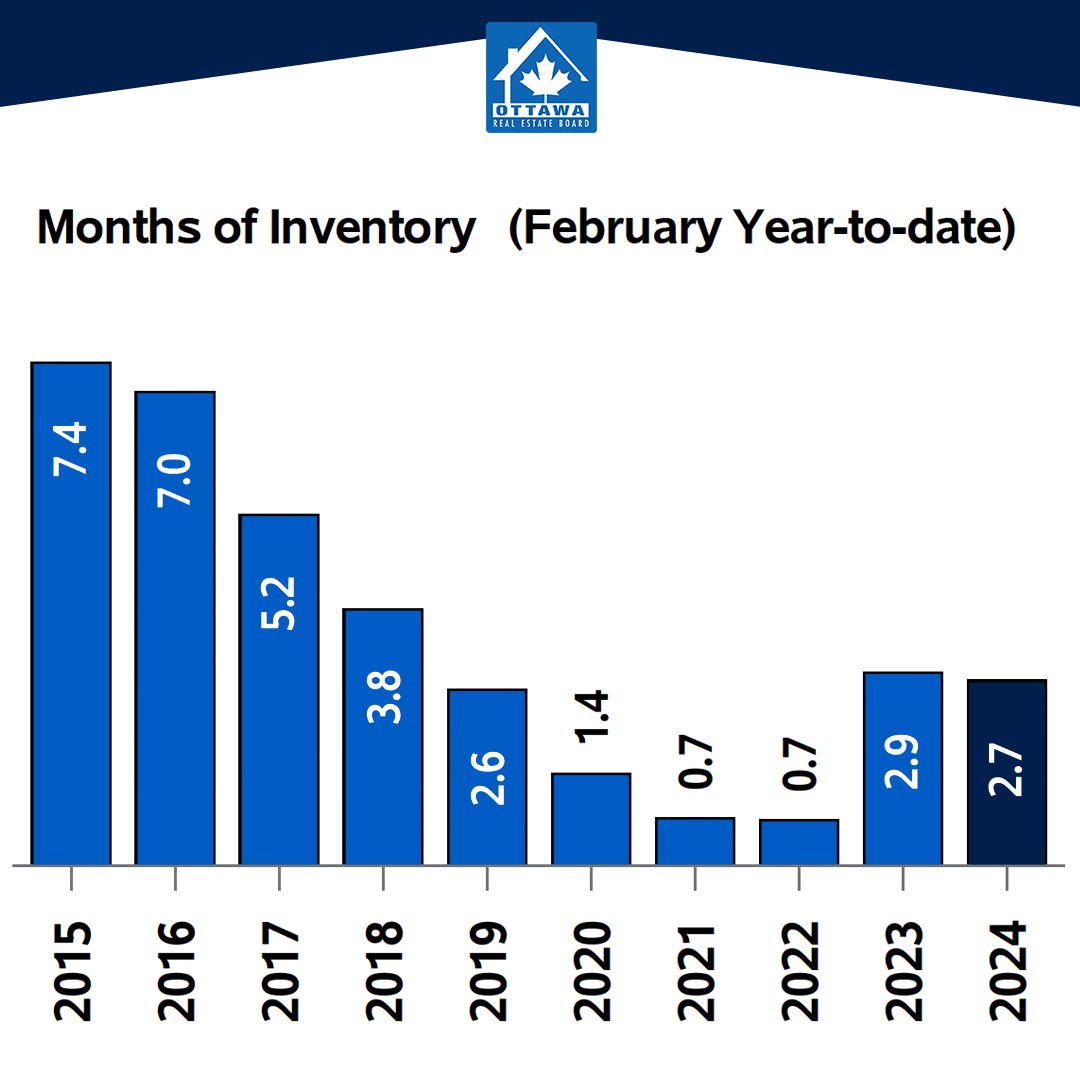
  • Months of inventory numbered 2.4 at the end of February 2024, unchanged from February 2023. The number of months of inventory is the number of months it would take to sell current inventories at the current rate of sales activity.

Ottawa’s MLS® Market Thawed in January but Sales Still Slow

The number of homes sold through the MLS® System of the Ottawa Real Estate Board totaled 629 units in January 2024. This was an increase of 16.5% from January 2023.

Home sales were 10.7% below the five-year average and 3.9% below the 10-year average for the month of January.

“Ottawa’s market activity is seeing positive gains over last year but it’s still a relatively quiet market even by pre-pandemic standards,” says OREB President Curtis Fillier. “While REALTORS® are telling us there’s lots of showing activity — probably thanks in part to the forgiving winter thus far — it’s not all translating to sales. This tells us that buyers are back out there looking, but still approaching cautiously. During the pandemic market, buyers had to move quickly and sometimes settle for a property that didn’t check all their boxes. Today, buyers are using the slower market to take the time needed to find their perfect place. Sellers would be well-advised to adjust their expectations and thoughtfully consider their pricing and timing strategy using the negotiating expertise and hyper-local data their REALTOR® can provide.”

“Ottawa’s market conditions can fluctuate quickly, though, because our supply is chronically low,” adds Brandon Reay, OREB’s policy and external relations manager. “Ottawa needs more suitable and affordable homes to address the housing crisis, and we need to increase density to meet population demands. We can’t restore and grow upon the market activity Ottawa saw five and ten years ago without more houses for people to buy. OREB recommends direct solutions for meaningful policy change, including streamlining the process at the Ontario Land Tribunal, eliminating exclusionary zoning, and permitting four units on residential lots. To meet the aggressive housing targets, we need to close the labour gap with investments in colleges and trade schools. We don’t need any more reactionary and distracting policy, like the federal government’s extension of the foreign buyers ban.”

By the Numbers – Prices:

The MLS® Home Price Index (HPI) tracks price trends far more accurately than is possible using average or median price measures.

  • The overall MLS® HPI composite benchmark price was $621,600 in January 2024, a gain of 3.2% from January 2023.
    • The benchmark price for single-family homes was $703,500, up 3.7% on a year-over-year basis in January.
    • By comparison, the benchmark price for a townhouse/row unit was $462,200, down 2.1% compared to a year earlier.
    • The benchmark apartment price was $418,500, up 3.7% from year-ago levels.
  • The average price of homes sold in January 2024 was $631,722, increasing 1.8% from January 2023.
  • The dollar volume of all home sales in January 2024 was $397.3 million, up 18.6% from the same month in 2023.

OREB cautions that the average sale price can be useful in establishing trends over time but should not be used as an indicator that specific properties have increased or decreased in value. The calculation of the average sale price is based on the total dollar volume of all properties sold. Price will vary from neighbourhood to neighbourhood.

By the Numbers – Inventory & New Listings

  • The number of new listings saw an increase of 7.3% from January 2023. There were 1,271 new residential listings in January 2024. New listings were 17.5% above the five-year average and 0.8% above the 10-year average for the month of January.
  • Active residential listings numbered 1,961 units on the market at the end of January 2024, a gain of 4.5% from the end of January 2023.
  • Active listings were 57.4% above the five-year average and 16.6% below the 10-year average for the month of January. Months of inventory numbered 3.1 at the end of January 2024, down from the 3.5 months recorded at the end of January 2023. The number of months of inventory is the number of months it would take to sell current inventories at the current rate of sales activity.

Ottawa MLS® December Home Sales Close Out Year in Steady State. Plus: Ottawa Real Estate Board’s New Leadership

The number of homes sold through the MLS® System of the Ottawa Real Estate Board totaled 565 units in December 2023. This was an increase of 7.6% from December 2022.

Home sales were 16% below the five-year average and 11.9% below the 10-year average for the month of December.

On a year-to-date basis, home sales totaled 11,978 units in all of 2023 — a decline of 11.0% from 2022.

“Ottawa’s resale market closed out the year in a steady, balanced state,” says OREB President Curtis Fillier. “This could be an early indication that consumer confidence is returning. We likely won’t see the full impact of rate stabilization until the second half of 2024, but December’s activity bodes well for a strong year ahead in Ottawa.”

“It hasn’t been the easiest market,” says Ken Dekker, OREB’s Past-President. “And while we probably won’t return to the peak levels seen in 2022, Ottawa’s market is poised to recover any ground lost in the past year. Both buyers and sellers need extra patience right now, but solid opportunities are there.”

By the Numbers – Prices:

The MLS® Home Price Index (HPI) tracks price trends far more accurately than is possible using average or median price measures.

  • The overall MLS® HPI composite benchmark price was $623,900 in December 2023, a modest gain of 2.7% from December 2022.
    • The benchmark price for single-family homes was $704,900, up 2.7% on a year-over-year basis in December.
    • By comparison, the benchmark price for a townhouse/row unit was $481,100, up 4.2% compared to a year earlier.
    • o The benchmark apartment price was $417,200, up 2.1% from year-ago levels.
  • The average price of homes sold in December 2023 was $632,487, increasing 1.7% from December 2022. The more comprehensive year-to-date average price was $667,794, a decline of 5.5% from 2022.
  • The dollar value of all home sales in December 2023 was $357.3 million, up 9.4% from the same month in 2022.

OREB cautions that the average sale price can be useful in establishing trends over time but should not be used as an indicator that specific properties have increased or decreased in value. The calculation of the average sale price is based on the total dollar volume of all properties sold. Price will vary from neighbourhood to neighbourhood.

By the Numbers – Inventory & New Listings

  • The number of new listings saw a major decrease of 12.4% from December2022. There were 523 new residential listings in December 2023. New listings were 4% below the five-year average and 16.1% below the 10-year average for the month of December.
  • Active residential listings numbered 1,844 units on the market at the end of December, a gain of 3.0% from the end of December 2022.
  • Active listings were 55.5% above the five-year average and 17.2% below the 10-year average for the month of December.
  • Months of inventory numbered 3.3 at the end of December 2023, down from the 3.4 months recorded at the end of December 2022. The number of months of inventory is the number of months it would take to sell current inventories at the current rate of sales activity.

New Year, New Leaders

In December, OREB Members elected a new Board of Directors to represent Ottawa’s 4,000 REALTORS® for 2024.

The new board will be comprised of 2024 President Curtis Fillier, Past-President Ken Dekker, President-Elect Paul Czan, and Vice-President Tami Eades. Joining them are directors Georgia Carrol, Laura Finlay, Julia Hay, Michael Lewicki, Jake Prescott, Jordyn Reid-Stevenson, Matt Richling, Ralph Shaw, and Russell Underhill.

Curtis — proudly the first openly gay OREB President — has been a dedicated volunteer of the board since 2014. His leadership extends to serving multiple terms on the Board of Directors and chairing various committees including Your Professional Network (YPN), Governance, and Finance and Audit, as well as planning OREB’s annual charitable golf tournament.

Prior to being a REALTOR®, Curtis worked in the accounting and tax advisory field. He is a Chartered Professional Accountant (CPA), holds a master’s degree in business and has experience across several corporations, including one of Canada’s largest privately owned businesses. Beyond his professional commitments, he enjoys travelling, fitness, home renovations, participating in 2SLGBTQ+ sports leagues, and spending quality time with his partner, Danny, and their dog, Bowser.

It was announced in late November that Janice Myers would move on from her role as OREB’s Chief Executive Officer to join the Canadian Real Estate Association as their CEO effective January 2, 2024. OREB’s Director of Corporate Services, Cherie Kirkby, assumes the role of interim CEO while a search for a permanent replacement is conducted.

Ottawa MLS® Home Sales Stable in November Amid Growing Supply

The number of homes sold through the MLS® System of the Ottawa Real Estate Board totaled 724 units in November 2023. This was a small reduction of 1.6% from November 2022.

Home sales were 31.8% below the five-year average and 27.4% below the 10-year average for the month of November.

On a year-to-date basis, home sales totaled 11,421 units after 11 months of the year. This was a decline of 11.7% from the same period in 2022.

“Sales are performing as expected with the arrival of colder months, and an uptick in new and active listings is bringing more choice back into the market,” says OREB President Ken Dekker. “While more choice may mean the pace of buying and selling has slowed, that doesn’t mean people looking to enter or upgrade in the market should sit back. Prospective buyers or those looking to upgrade have an opportunity to collaborate with their REALTOR® to carefully explore the market, identify the ideal property, and negotiate an attractive deal at their own pace. Sellers will have to manage their expectations regarding the quantity of offers and speed of transactions, and their REALTOR® is the best resource to help them confidently price and prepare their home for a quality sale.”

By the Numbers – Prices:

The MLS® Home Price Index (HPI) tracks price trends far more accurately than is possible using average or median price measures.

  • The overall MLS® HPI composite benchmark price was $628,900 in November 2023, nearly unchanged, up only 1.4% from November 2022.
    • The benchmark price for single-family homes was $708,900, up 1.6% on a year-over-year.
    • By comparison, the benchmark price for a townhouse was $492,300, nearly unchanged, up 0.8% compared to a year earlier.
    • The benchmark apartment price was $424,300, up 1.2% from year-ago levels.
  • The average price of homes sold in November 2023 was $633,138, decreasing 0.8% from November 2022. The more comprehensive year-to-date average price was $669,536, a decline of 5.7% from 11 months of 2022.
  • The dollar value of all home sales in November 2023 was $458.4 million, down 2.4% from the same month in 2022.

OREB cautions that the average sale price can be useful in establishing trends over time but should not be used as an indicator that specific properties have increased or decreased in value. The calculation of the average sale price is based on the total dollar volume of all properties sold. Price will vary from neighbourhood to neighbourhood.

By the Numbers – Inventory & New Listings

  • The number of new listings saw an increase of 2.7% from November 2022. There were 1,428 new residential listings in November 2023. New listings were 8.4% above the five-year average and 10.4% above the 10-year average for the month of November.
  • Active residential listings numbered 2,752 units on the market at the end of November, a sizable gain of 15.8% from the end of November 2022.
  • Active listings were 53.9% above the five-year average and 6.7% below the 10-year average for the month of November. Active listings haven’t been this high in the month of November in more than five years.
  • Months of inventory numbered 3.8 at the end of November 2023, up from the 3.2 months recorded at the end of November 2022 and above the long-run average of 3.3 months for this time of year. The number of months of inventory is the number of months it would take to sell current inventories at the current rate of sales activity.

A Special Message from the Ottawa Real Estate Board: Promoting a more inclusive and accepting community

This message on behalf of the board of directors is to address the recent social media posts and discussions by members of the Ottawa Real Estate Board (OREB) promoting hateful thoughts against the LGBTQ2S+ community.

Hate has no place in our community. OREB unequivocally and unapologetically condemns any message or behaviour of intolerance and divisiveness against all persons, families and communities. 

Chief among the values that we uphold are professionalism, integrity and ethical practice. At OREB, we are resolute in our commitment to fostering a diverse, equitable, and inclusive environment for our staff, our members, and clients. We believe in treating everyone with respect and ensuring that our industry serves the needs of all individuals, and we will continue our efforts to promote a more inclusive and accepting community.

Ken Dekker
Ottawa Real Estate Board
2023 President

Unreserved.com Inc.’s legal action against OREB and Penny Torontow withdrawn

Ottawa — Unreserved.com Inc. and the Ottawa Real Estate Board (OREB) and Penny Torontow confirm that the legal action initiated by Unreserved.com Inc. against OREB and Ms. Torontow has been withdrawn to the mutual satisfaction of the parties on a no-costs/no-damages basis. 

As per the terms of the parties’ mutual release and agreement, OREB cannot provide any further information. 

Kate Headley
Senior Manager, Communications 
613-225-2240, ex. 247
kate@oreb.ca

Residential Resale Slowdown Begins A Shift Towards Balance

Members of the Ottawa Real Estate Board sold 1,110 residential properties in July through the Board’s Multiple Listing Service® System, compared with 1,718 in July 2021, a decrease of 35 per cent. July’s sales included 840 in the residential-property class, down 36 per cent from a year ago, and 270 in the condominium-property category, a decrease of 34 per cent from July 2021. The five-year average for total unit sales in July is 1,691.

Members of the Ottawa Real Estate Board sold 1,110 residential properties in July through the Board’s Multiple Listing Service® System, compared with 1,718 in July 2021, a decrease of 35 per cent. July’s sales included 840 in the residential-property class, down 36 per cent from a year ago, and 270 in the condominium-property category, a decrease of 34 per cent from July 2021. The five-year average for total unit sales in July is 1,691.

“We are witnessing a profound slowdown in Ottawa’s resale market. July’s numbers reveal that Buyers are indeed putting on the brakes more heavily than what is typically expected during the mid-summer sales dip. Aggressive interest rate increases are surely impacting the decision to buy at the moment as well as other factors that I mentioned last month,” states OREB President Penny Torontow. “But there is a silver lining: with more properties continually being added to inventory, we are on the cusp of returning to a balanced market, and that is good news,” she adds.

“July saw 2,338 new listings added to the housing stock, which is on par with the 5-yr average and 5% lower than last year at this time. Our inventory for residential-class properties is currently around 2.9 months and 2.5 months for condominiums. A market is considered balanced with at least four months of supply, so we are well on our way to that paradigm.”

The average sale price for a condominium-class property in July was $425,694, an increase of 1 per cent from 2021, while the average sale price for a residential-class property was $716,354, increasing 5 per cent from a year ago. With year-to-date average sale prices at $805,238 for residential and $461,557 for condominiums, these values represent an 11 per cent and 9 percent increase over 2021, respectively.*

“The double-digit average price increases that we saw in the past couple of years right up until the early spring have now morphed into single-digit increases, which aligns more with our traditional stable year-over-year price growth. However, it is important to point out that average prices tally the entire spectrum of home sales across the city and region. If you look from neighbourhood to neighbourhood, there are so many differing characteristics and attributes, price increases will certainly fluctuate depending on where you live,” suggests Torontow.

“If you are selling your home, now is the time to be patient as days on market return to more normal timeframes. There are still many Buyers out there, but with more choice, they have less pressure and may take their time. Even though interest rates are still quite reasonable from a historical perspective, consumers are adjusting to this new reality. The rising cost of all goods means people need time to evaluate and adapt their mindsets.”

“I also believe it is time for the federal government to adapt and reassess the stress test. It was originally designed when rates were very low to ensure Buyers could manage rate hikes. With interest rates where they are now, they have to qualify at a 7-8% rate which no longer makes sense and takes many Buyers out of the market.”

“Whether you are a Buyer or a Seller, a professional licensed REALTOR® will help you navigate this shifting resale market. They have access to minute-by-minute sales data and local neighbourhood expertise that will assist you in making the best decisions for your circumstances.”

REALTORS® also help with finding rentals and vetting potential tenants. Since the beginning of the year, OREB Members have assisted clients with renting 3,528 properties compared to 2,706 last year at this time.

* OREB cautions that the average sale price can be useful in establishing trends over time but should not be used as an indicator that specific properties have increased or decreased in value. The calculation of the average sale price is based on the total dollar volume of all properties sold. Price will vary from neighbourhood to neighbourhood.

Residential Resale Market’s Shifting Benchmark Reality

Members of the Ottawa Real Estate Board sold 1,508 residential properties in June through the Board’s Multiple Listing Service® System, compared with 2,122 in June 2021, a decrease of 29 per cent. June’s sales included 1,138 in the residential-property class, down 31 per cent from a year ago, and 370 in the condominium-property category, a decrease of 23 per cent from June 2021. The five-year average for total unit sales in June is 1,966.

Members of the Ottawa Real Estate Board sold 1,508 residential properties in June through the Board’s Multiple Listing Service® System, compared with 2,122 in June 2021, a decrease of 29 per cent. June’s sales included 1,138 in the residential-property class, down 31 per cent from a year ago, and 370 in the condominium-property category, a decrease of 23 per cent from June 2021. The five-year average for total unit sales in June is 1,966.

“After the frenzy of the past two years, we are witnessing Ottawa’s resale market normalize in 2022 and shift towards the more traditional seasonal ebb and flow cycle. While June transactions do typically taper as many look towards their summer holidays, last month’s sales were at a slower pace than we have seen in well over a decade,” states Ottawa Real Estate Board President Penny Torontow.

“We can likely attribute the decrease in unit sales to economic factors such as rising interest rates and cost of living/inflation. Other dynamics could include Buyer fatigue combined with a wait-and-see approach towards home prices, lack of confidence amongst consumers, and perhaps the uncertainty surrounding back-to-work arrangements as a long commute with rocketing gas prices will certainly affect decisions about where to live,” she adds. 

The average sale price for a condominium-class property in June was $438,977, an increase of 1 per cent from 2021, while the average sale price for a residential-class property was $772,861, increasing 6 per cent from a year ago. With year-to-date average sale prices at $815,797 for residential and $465,573 for condominiums, these values represent an 11 per cent and 10 percent increase over 2021, respectively.*

“It’s no secret that price increases have become more modest in the last two months–there’s a new benchmark reality in Ottawa. While our average price statistics provide an overall picture, as the market settles, there will be adjustment differences in various pockets of the city. For example, what happens in Westboro will not likely mirror Findlay Creek,” advises Torontow.

“But even as prices fluctuate, historically, real estate in Ottawa has always been and will continue to be stable and dependable in the long term. We aren’t likely to ever experience the significant dips that other regions may see. Prices won’t fall out; they are prone to level off to the reasonable rates of increase that we have historically experienced.”

“With an influx of 3,213 new listings in June, we are moving (albeit gradually) towards the goal of a more balanced market. Residential inventory has increased by 38% over last year at this time and is sitting at an approximate 1.9 months’ supply currently. Condominium housing stock has risen 14% to a 1.6 months’ supply for that property class. Once government-pledged supply measures are enacted, we are optimistic that goal is within reach.”

“Buyers, if you have been waiting on the sidelines, this may be an optimal time to venture back into your home search. There is more selection, fewer bidding wars, and less pressure to make a warp-speed decision. As for Sellers, your neighbourhood has its own characteristics and attributes that should weigh into the calculation of your property’s value. Contact a professional REALTOR® who has their hand on the pulse of Ottawa’s shifting real estate market today!”

REALTORS® also help with finding rentals and vetting potential tenants. Since the beginning of the year, OREB Members assisted clients with renting 2,919 properties compared to 2,252 last year at this time.

* OREB cautions that the average sale price can be useful in establishing trends over time but should not be used as an indicator that specific properties have increased or decreased in value. The calculation of the average sale price is based on the total dollar volume of all properties sold. Price will vary from neighbourhood to neighbourhood.

Ottawa’s May Residential Resales Underperform Expectations

Members of the Ottawa Real Estate Board sold 1,846 residential properties in May through the Board’s Multiple Listing Service® System, compared with 2,285 in May 2021, a decrease of 19 per cent. May’s sales included 1,384 in the residential-property class, down 22 per cent from a year ago, and 462 in the condominium-property category, a decrease of 11 per cent from May 2021. The five-year average for total unit sales in May is 2,031.

Members of the Ottawa Real Estate Board sold 1,846 residential properties in May through the Board’s Multiple Listing Service® System, compared with 2,285 in May 2021, a decrease of 19 per cent. May’s sales included 1,384 in the residential-property class, down 22 per cent from a year ago, and 462 in the condominium-property category, a decrease of 11 per cent from May 2021. The five-year average for total unit sales in May is 2,031.

“With year-over-year resales declining in March and April, and now with this downward trend continuing into May, traditionally the highest performing month for resales, it is quite clear that Ottawa’s resale market is shifting away from the blazing pace of 2021,” states Ottawa Real Estate Board President Penny Torontow. “And if rising interest rates, cost of living, and inflation aren’t enough factors to cause a pullback, the powerful and deadly storm that brought our city to its knees last month has justifiably impacted the market as well.”

“Our data shows a sharp decline in new listings with a corresponding increase in cancelled/suspended listings on the MLS® System in the period following the storm. Overall, in May, however, there were 3,120 properties that entered the market. This is on par with last May and is 5% over the 5-year average. The result is an 18% increase in residential-class inventory. Meanwhile, there was a slight decline (0.4%) in condominium inventory, but this is not surprising since they have likely become an entry point for many first-time homebuyers due to the affordable price point.”

The average sale price for a condominium-class property in May was $472,920, an increase of 11 per cent from 2021, while the average sale price for a residential-class property was $802,393, increasing 8 per cent from a year ago. With year-to-date average sale prices at $824,276 for residential and $470,353 for condominiums, these values represent a 12 per cent increase over 2021 for both property classes.*

“Average prices, while still higher than 2021, are showing signs of adjusting to the pace of the market with a month-over-month decrease of 2% in both property classes. In April, we also saw a decline of 1-3%. In contrast, January to March experienced month-to-month increases ranging from 2% to 12%. This may be good news for Buyers, including the fact that the months of inventory have increased to 1.2 for residential and 1 month for condominiums. We are still a far cry away from a balanced market, but it finally seems to be moving in the right direction,” Torontow suggests.

“Additionally, another statistic that we see increasing is the cumulative days on market (CDOM), which is now 14 days, increasing from 11 days last May. CDOMs are typically between 30-60 days in a balanced market, and usually closer to that one-month mark in Ottawa. I mention this because we don’t want Sellers to panic if their homes aren’t selling as quickly as perhaps their neighbours’ properties did. Buyers will also have a little more breathing room if this trend continues.”

“But at the end of the day, each property for sale has its own hyper-local market factors (location, condition, other properties for sale in the same neighbourhood, etc.) that will affect the final sale price. If you want to know the most accurate price point to sell your home or what is the true market value of a home you are interested in, a licensed professional REALTOR® has the education and the experience with access to the most current market statistics and property information, to guide you into making the optimal decision for you and your budget.”

REALTORS® also help with finding rentals and vetting potential tenants. Since the beginning of the year, OREB Members assisted clients with renting 2,320 properties compared to 1,837 last year at this time.

* OREB cautions that the average sale price can be useful in establishing trends over time but should not be used as an indicator that specific properties have increased or decreased in value. The calculation of the average sale price is based on the total dollar volume of all properties sold. Price will vary from neighbourhood to neighbourhood.

April Residential Resales in a Flux

Members of the Ottawa Real Estate Board sold 1,889 residential properties in April through the Board’s Multiple Listing Service® System, compared with 2,394 in April 2021, a decrease of 21 per cent. April’s sales included 1,419 in the residential-property class, down 23 per cent from a year ago, and 470 in the condominium-property category, a decrease of 13 per cent from April 2021. The five-year average for total unit sales in April is 1,849.

Members of the Ottawa Real Estate Board sold 1,889 residential properties in April through the Board’s Multiple Listing Service® System, compared with 2,394 in April 2021, a decrease of 21 per cent. April’s sales included 1,419 in the residential-property class, down 23 per cent from a year ago, and 470 in the condominium-property category, a decrease of 13 per cent from April 2021. The five-year average for total unit sales in April is 1,849.

“With the number of transactions just slightly over the 5-year average, this was one of the weakest performing Aprils we have seen in a while,” states Ottawa Real Estate Board’s President Penny Torontow. “Considering that the number of new listings increased last month, it is a bit of a surprise that sales were off.”

“Certainly, there are a few factors at play: rising interest rates, growing Buyer frustration, April’s cooler temperatures, as well as the housing supply measures recently announced by the government – these could all be causing Buyers to pull back with a wait-and-see approach. We are watching the rest of the spring market closely to determine if this could perhaps be an early indicator of a shift in the market. Since April is only one month, we will be monitoring to see if it becomes a trend moving forward.”

“The fact remains that it is still a Seller’s market with supply under one month. Bidding wars and multiple offers persist in some pockets, prices continue to rise, albeit more moderately, and the market remains relatively strong,” she adds.

The average sale price for a condominium-class property in April was $473,702, an increase of 11 per cent from 2021, while the average sale price for a residential-class property was $829,318, increasing 12 per cent from a year ago. With year-to-date average sale prices at $830,588 for residential and $469,603 for condominiums, these values represent a 13 per cent and 12 percent increase over 2021, respectively.*

“Limited supply and high demand will continue to place upward pressure on prices. And as long as there are Buyers willing to pay, average prices will reflect the inventory shortage. However, it is conceivable that price growth may moderate as we do not see the level of price escalations that occurred earlier in the pandemic,” Torontow suggests.

“Although the number of new listings in April (2,846) was down by 11% from 2021, the number of properties that entered the market was still 10% over the 5-year average (2,600), and 214 units more than what was added to the housing stock in March. This has increased Ottawa’s months of inventory to just under a month’s supply. In March, it was just over two weeks. This is good news for potential Buyers as they will have more options and more opportunities to enter the market.”

“In fact, the condominium market may be performing slightly better than residential property classes due to the fact that they are the most affordable price point to enter the market and could possibly now be considered the new entry-level property type.”

“We have also noticed a marked increase in the number of rental properties listed on the MLS® System. Since the beginning of the year, OREB Members assisted clients with renting 1,786 properties compared to 1,458 last year at this time. An increase of 23% and almost double the quantity recorded in pre-pandemic years. As for lease prices, the average cost for a 1-bdrm is approximately $1,850, and a 2-bdrm is $2,200 for rentals listed on the MLS® System. These values are roughly 3-4% higher than this time in 2021. Ottawa REALTORS® are an excellent resource when it comes to finding a rental property or vetting tenants – contact one today!”

* OREB cautions that the average sale price can be useful in establishing trends over time but should not be used as an indicator that specific properties have increased or decreased in value. The calculation of the average sale price is based on the total dollar volume of all properties sold. Price will vary from neighbourhood to neighbourhood.