
OTTAWA, ON — Ottawa’s market continues to be resilient despite broader concerns about economic uncertainty. In October, Ottawa’s housing market experienced a modest, seasonal increase in sales activity accompanied by a reduction in the elevated inventory levels seen in recent months. This points to a stable yet cautious phase for the region as we move into the typically slower winter season.
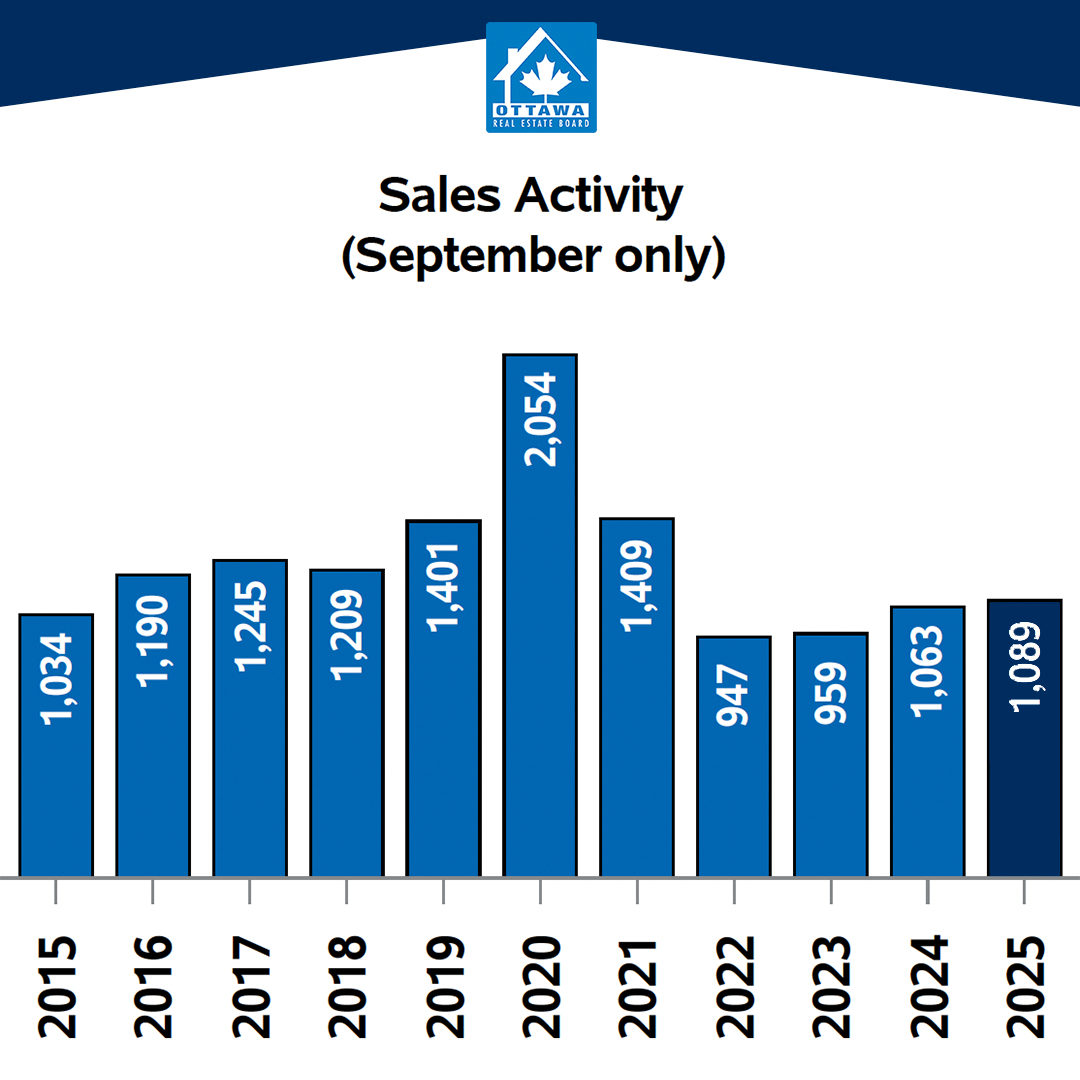
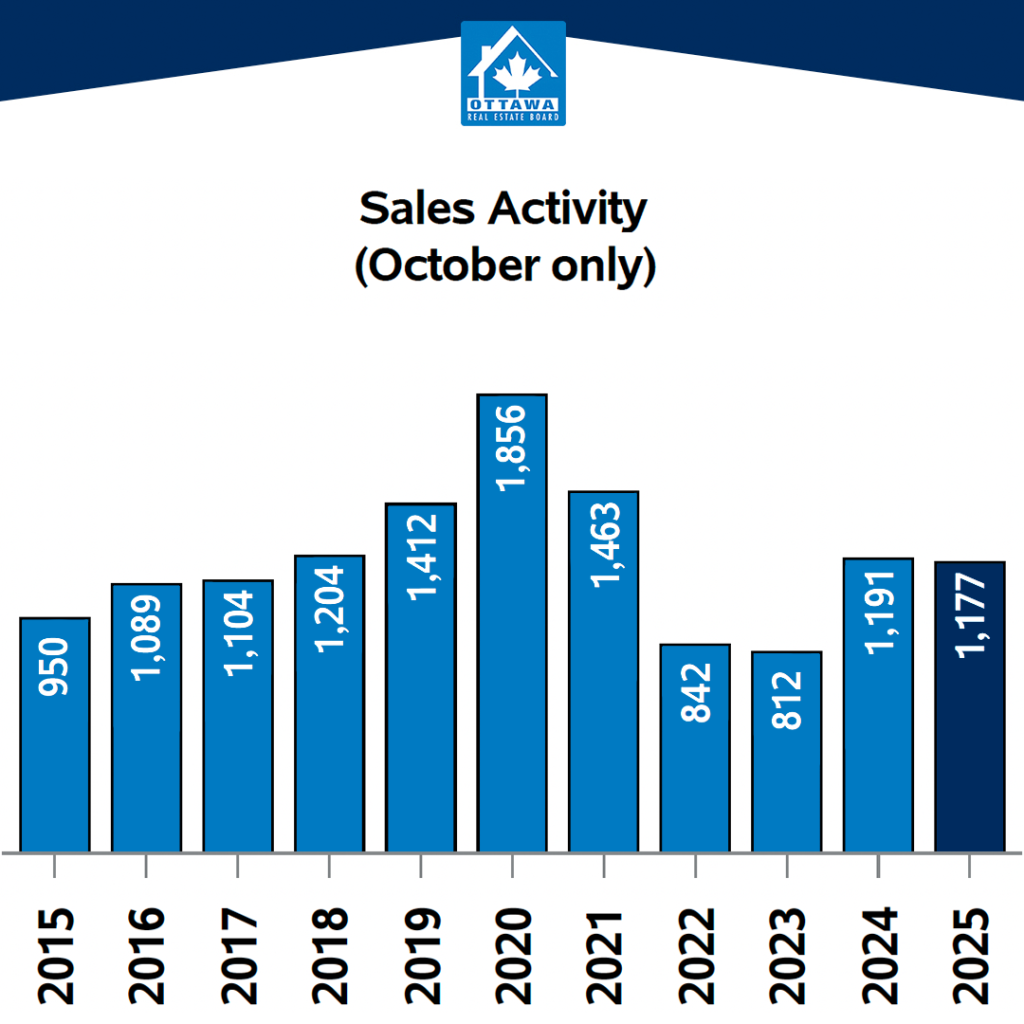
Last month, a total of 1,177 homes were sold, up 8.1% from 1,089 in September 2025, but down slightly year over year with a 1.2% decrease compared to October of 2024. The average sale price climbed to $709,002, an increase of 2.7% month over month and 5.7% higher than the same period last year, suggesting that underlying demand remains resilient.
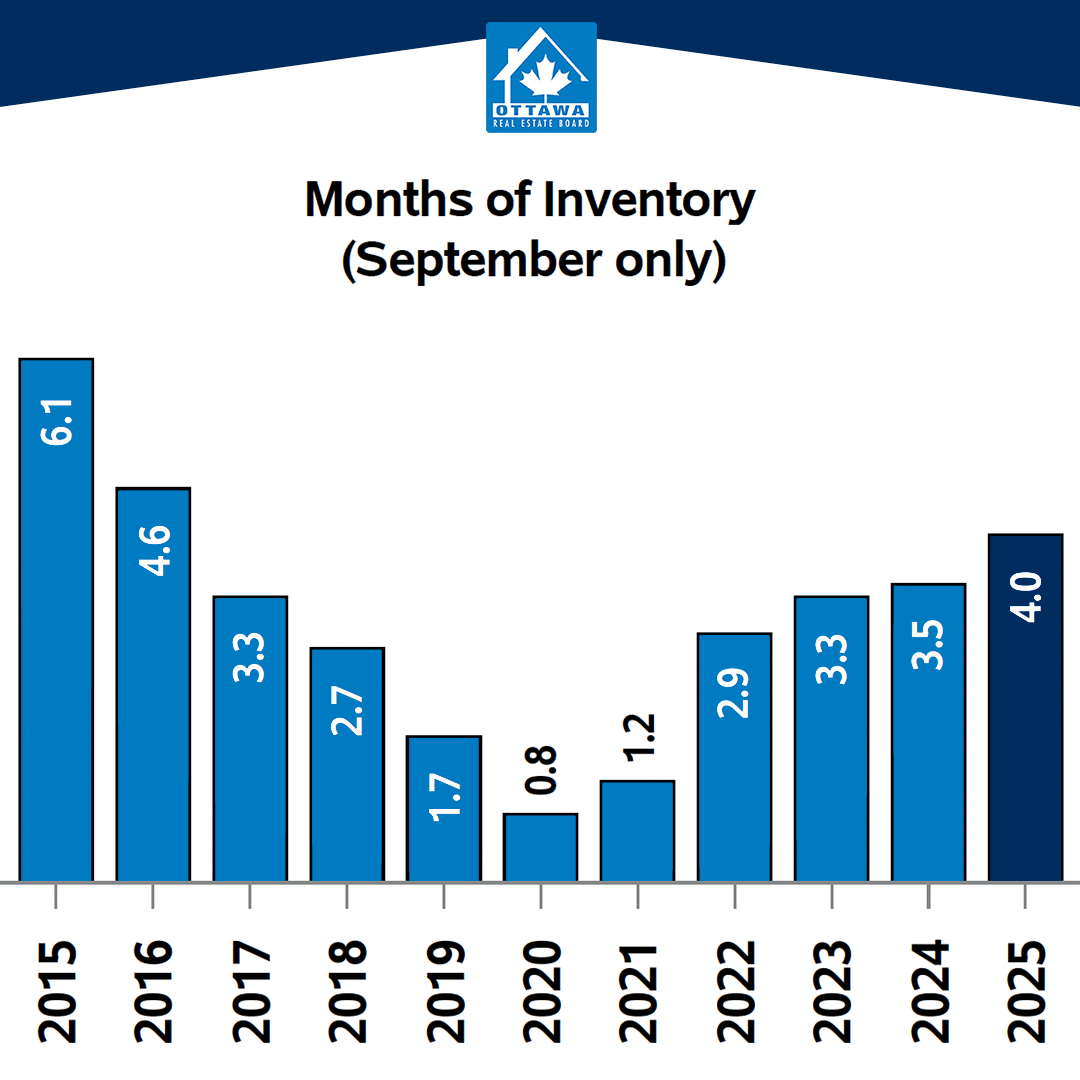
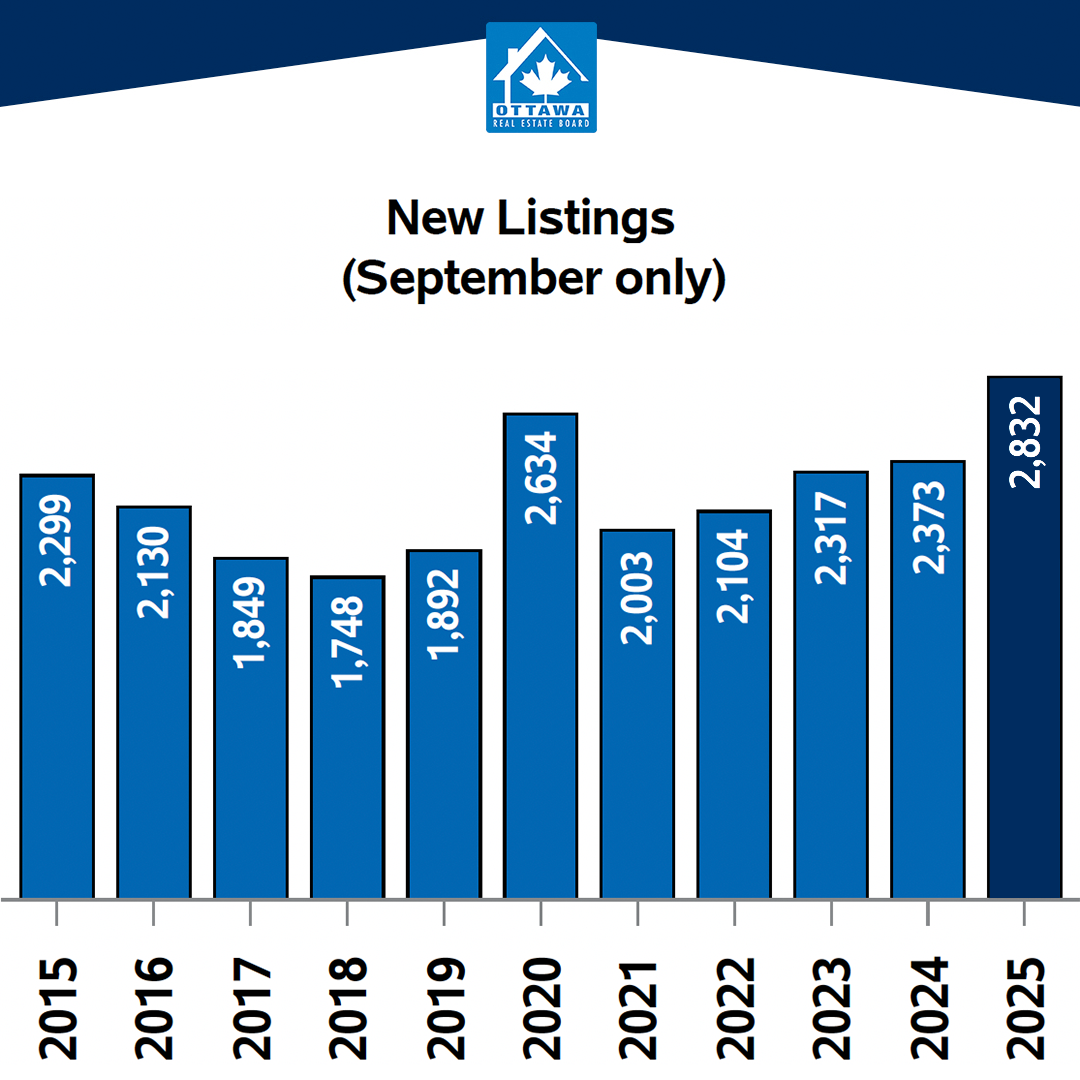
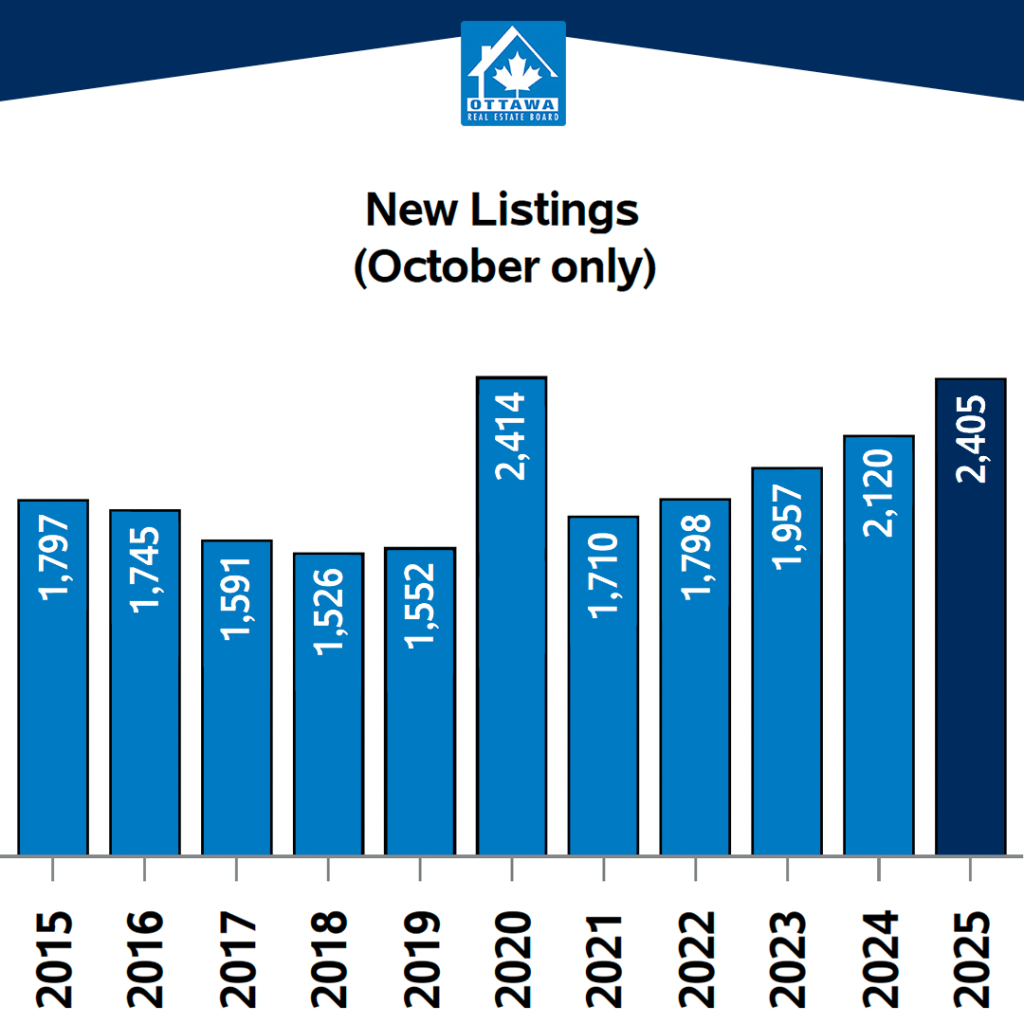
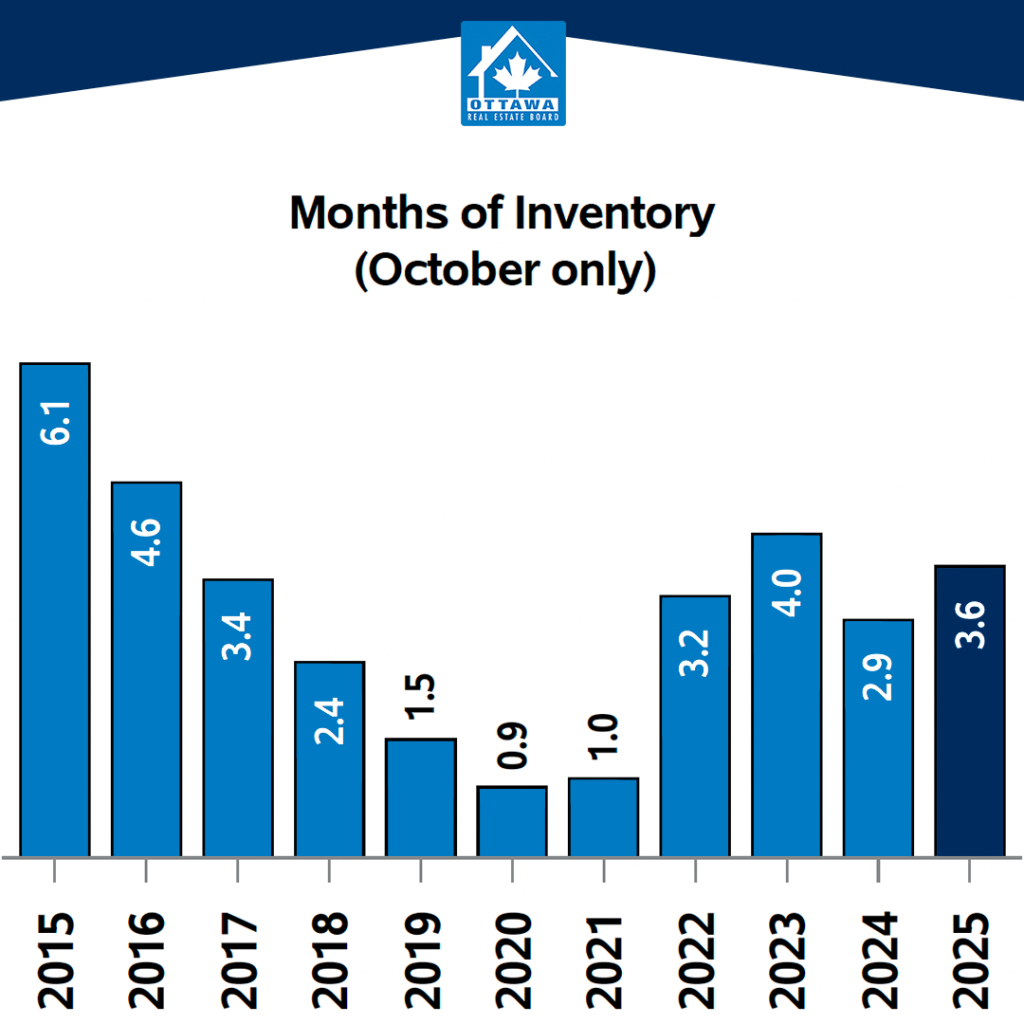
Ottawa saw 2,405 new listings in October, a 15.1% decline from September 2025, but 13.4% higher than October 2024. This seasonal drop off in new listings between September and October has been a consistent pattern over the past decade. More notably, active listings fell from 4,388 in September to 4,232 in October, a 3.6% decrease. While inventory levels remain higher than in recent years, this familiar fall decrease in active listings suggests that the trend towards elevated supply levels may be starting to stabilize, still within a balanced market range. Reinforcing that trend, the months of inventory measure eased from 4.0 to 3.6, indicating a modest tightening in the balance between buyers and sellers as the fall market settled.
The Bank of Canada’s second consecutive rate cut on Oct. 29, 2025, lowered the policy rate by 25 basis points to 2.25%, providing additional relief to borrowers and some optimism for an active spring market. However, the bank tempered expectations for further easing, noting in its statement that this is likely the final cut in the current cycle. The Ottawa Real Estate Board (OREB) is monitoring the newly released federal budget and workforce announcements, as cuts in either area have historically affected Ottawa’s housing market given the city’s large federal employment base.
Overall, Ottawa continues to display a pattern of measured balance, modestly improving demand, steady prices, and a market environment that remains fundamentally healthy as it heads toward year-end.
“Ottawa’s market continues to demonstrate balance and resilience,” said OREB President Paul Czan. “We’re seeing modest growth in sales activity, stable pricing, and a seasonal easing of elevated inventory levels. The recent rate adjustments provide optimism for the coming months, but economic uncertainty looms, and buyers and sellers remain cautious, watching how broader economic factors play out. The current environment points to a steady market rather than a rapid shift in either direction.”
Residential Market Activity
Year to date, 12,197 homes have sold, a 3.3% increase over the first 10 months of 2024. The total dollar volume through October reached $8.55 billion, up 6.5% year over year, while the average year-to-date price stands at $700,869, a 3.0% increase year over year.
Looking at the bigger picture, there have been 12,197 home sales so far this year, a 3.3% increase compared to the same period in 2024.
The average sale price for all sold listings in October was $709,002, up 5.7% from last year and 2.7% higher than September.
The year-to-date average price now stands at $700,869, a 3.0% increase over the first ten months of 2024.
Altogether, the total value of homes sold in October was approximately $834.5 million, a 4.5% year-over-year increase, and sits just under $8.5 billion year to date, a significant 6.5% increase over the same period of time in 2024.
On the listing side, there were 2,405 new residential listings added in October, down 15.1% from September but still 13.4% higher than last year.
Active listings totaled 4,232, a 3.6% decrease from September but 21.3% higher year over year.
The months of inventory, a key measure of supply, eased from 4.0 in September to 3.6, reflecting a slightly tighter balance between supply and demand within what remains a generally balanced market.
MLS® Home Price Index (HPI)
The MLS® Home Price Index (HPI) composite benchmark for Ottawa was $622,700 in October, down 0.7% month over month but up 0.7% year over year, continuing the trend of moderate, sustainable price movements rather than volatility.
By property category:
- Single-family: $692,400 up 0.3% compared to 2024
- Townhouse: $456,300 up 6.6% compared to 2024
- Apartment: $402,900 up 0.1% compared to 2024
For media inquiries, please contact:
Melanie Coulson, Director of Strategic Communications & Engagement
613-225-2240 ext.247 | melanie@oreb.ca