

ARCHIVE

Ottawa Home Sales Pull Back Sharply in August While Prices Hold Steady

Market Overview

Ottawa’s housing market lost momentum in August. Sales declined sharply both year over year and from the previous month, reversing July’s incremental improvement and widening the year-to-date gap compared with 2025.

The slowdown was not driven by a new influx of supply. New listings and active listings both declined from July, but sales fell much faster, weakening the relationship between available supply and demand. Listing activity also suggests that some sellers may be pausing or reassessing their plans, rather than proceeding under current conditions. Months of inventory rose to its highest August level since 2016.

Pricing remained comparatively stable. The average sale price and composite benchmark price were both slightly higher than a year earlier, while the median price declined modestly. Overall, August presents a softer picture heading into the fall market, with mixed indicators of market strength and weakness.

“Prices remained relatively steady despite the pullback in sales, which tells us this is not a simple story of the market moving uniformly in one direction,” said OREB President Tami Eades. “Buyers are seeing less competitive conditions and have more time to make decisions, while sellers are facing more competition and may need to be thoughtful about pricing and positioning their homes for the current market. One month does not establish a trend, but the shift in sales and inventory is something we’ll be watching closely as we head into the fall market.”

Residential Market Activity

A total of 1,002 homes were sold through the MLS® System in August, down 18.6% from August 2025. Sales also declined 24.4% from July. By comparison, the median July-to-August decline over the previous 10 years was 5.8%, confirming that this year’s slowdown was substantially larger than normal seasonal variation. The August total tied 2022 for the lowest August sales count since 2016.

The sales decline extended across all three major property types:

  • Single-family sales fell 16.3% year over year to 535 transactions.
  • Townhouse sales fell 19.9% to 310.
  • Apartment sales fell 22.3% to 136.

This broad-based weakness differs from earlier months, when the softer activity was more concentrated in townhouses and apartments.

Year to date, 9,283 homes have sold in Ottawa, down 6.9% from the same period in 2025. The year-to-date shortfall widened from 5.2% at the end of July, reversing the incremental improvement recorded last month. Total year-to-date dollar volume was approximately $6.5 billion, down 7.2% year over year.

Prices and Market Balance

The average residential sale price was $688,253 in August, up 0.3% from a year earlier and 0.7% from July. The median price was $622,357, down 1.2% year over year and 2.0% from July.

The MLS® Home Price Index, a measure less affected by changes in the types of properties sold, recorded a composite benchmark price of $637,700. This was 1.0% higher than in August 2025 and 0.6% higher than in July. Taken together, the price measures indicate that values were considerably steadier than sales activity.

There were 2,119 new listings in August, unchanged from a year earlier and down 16.2% from July. Active listings totalled 4,496, up 11.3% year over year but down 3.9% from July. The monthly declines in new and active listings were broadly consistent with seasonal patterns, but active inventory remained at its highest August level since 2016.

The decline in active listings should not be interpreted as inventory being absorbed primarily through sales. An OREB review of listing records indicates that terminations, cancellations and expirations became more prominent relative to completed transactions through the summer. Although these non-sale removals declined from July, sales fell more sharply, meaning a greater proportion of properties left the market without producing a sale. One explanation for this behaviour could be that some sellers may be stepping back or reassessing their plans to sell under current conditions.

The sales-to-new-listings ratio fell from 52.4% in July to 47.3% in August as sales declined faster than new listings. Months of inventory increased from 3.5 to 4.5. Over the previous 10 years, the median July-to-August change in months of inventory was zero, and no increase exceeded 0.4 months. This year’s one-month jump in MOI therefore represents a meaningful weakening in absorption rather than a typical summer movement.

Other transaction measures changed only modestly. Homes sold for an average of 97.9% of their listing price, unchanged from August 2025, while the median time on market increased from 28 days last August to 29 days. These figures remain consistent with broadly balanced conditions, despite the softening of other indicators.

Single-family homes remained the most stable major segment. The single-family benchmark price rose 2.2% year over year, while months of inventory reached 4.0. Townhouses recorded 4.1 months of inventory, with active listings 27.1% above last year and a benchmark price 4.0% lower year over year. The weakening of the townhouse market is something worth monitoring closely.

Of all the property segments, apartment conditions remained the softest in August, continuing the pattern observed throughout 2026 and the second half of 2025. Apartments recorded 6.3 months of inventory, a 43.0% sales-to-new-listings ratio and a median of 42 days on market. However, active apartment listings declined from July, the sales-to-new-listings ratio improved slightly and the apartment benchmark rose 1.9% month over month. The August figures therefore show continued softness, but not a decisive new deterioration.

Regional Market Comparison

Ottawa’s three suburban submarkets continued to account for more than 70% of residential sales in August, but all three recorded year-over-year declines. Sales fell 14.3% in Ottawa Suburb West, 20.0% in Ottawa Suburb East and 25.1% in Ottawa Suburb South.

Ottawa Suburb West had the firmest absorption among the three suburban markets, with a sales-to-new-listings ratio of 51.9% and 3.6 months of inventory. Ottawa Suburb East and Ottawa Suburb South each recorded 4.1 months of inventory, with sales-to-new-listings ratios below the citywide level.

Softer conditions were more pronounced in Ottawa Center and Ottawa Rural East. Ottawa Center recorded 81 sales, a sales-to-new-listings ratio of 38.2% and 7.0 months of inventory. Ottawa Rural East recorded 84 sales, a ratio of 40.6% and 6.5 months of inventory.

Ottawa Rural West was the only submarket to record a year-over-year sales increase, rising 22.6%, and had the highest sales-to-new-listings ratio at 62.3%. However, its 76 transactions represented a relatively small share of citywide activity, and the percentage increase should therefore be interpreted cautiously.

Overall, the regional results indicate that August’s slowdown was not confined to one part of Ottawa. Absorption remained comparatively firmer in the western suburban and rural markets, while central Ottawa and Rural East experienced more supply-sensitive conditions.

Looking Ahead

August’s softer housing results came against an uncertain, though improving national economic backdrop. Statistics Canada reported that real GDP grew at an annualized rate of 3.3% in the second quarter, while first-quarter growth was revised upward to 0.3%. The Bank of Canada’s July outlook similarly described the economy as showing signs of improvement, while emphasizing that uncertainty remained elevated.

CMHC’s 2026 outlook expects sales in the Ottawa metropolitan area to stabilize, while slower demand growth and increasing supply limit price increases. CMHC also expects the local rental market to continue softening as elevated construction moves toward completion.

At the national level, RBC Economics expects home resales and benchmark prices to decline overall in 2026 before beginning a modest recovery in 2027. Its latest outlook forecasts national transactions rising 6.7% next year, but cautions that the recovery is likely to remain irregular as affordability pressures, slower population growth and economic uncertainty continue to affect demand.

For Ottawa, the central question heading into the fall market is whether August represents a temporary interruption or the beginning of a more sustained slowdown. One month does not establish a trend, but the unusually sharp sales decline, lower sales-to-new-listings ratio, higher months of inventory and wider year-to-date shortfall are important signals to monitor. Whether properties that left the market without selling return during the fall, perhaps with new pricing strategies, will also help indicate whether some sellers were temporarily pausing their plans or withdrawing for a longer period.

Media contact

Melanie Coulson
Director of Strategic Communications & Engagement
613-225-2240 ext. 247 | melanie@oreb.ca

Ottawa Home Sales Hold Steady as New Listings Ease in July

Market Overview

Ottawa’s housing market held up better than usual as the spring market gave way to summer. Sales in July were virtually unchanged from a year earlier, while new listings edged lower, improving the balance between incoming supply and sales compared with June. July marked the second time in three months that new listings fell below year-earlier levels, adding to signs that the flow of new supply is beginning to moderate and balance, even as the overall number of homes available remained high relative to recent historical trends.

Sales declined 12.7% from June, compared with a median June-to-July decrease of 20.7% over the previous decade. New listings fell at a more typical seasonal pace, allowing the relationship between new supply and sales to improve.

Pricing indicators were mixed, but once again they collectively pointed to stability rather than a market-wide shift. The average sale price was 1.6% lower than in July 2025, while the median price was unchanged. This divergence suggests that the mix of homes sold contributed to the decline in the average price.

Conditions also remained segmented geographically and by type. Absorption was generally firmer in the suburban markets, while the condominium apartment market continued to experience softer conditions, particularly in the downtown core.

“July’s results point to a steady market as it moves through the typical summer slowdown,” said OREB President Tami Eades. “Sales remained close to last year’s level, while fewer new listings helped improve the balance between supply and demand. However, conditions continue to vary significantly by property type and neighbourhood, reinforcing the importance of local data and informed guidance when making real estate decisions.”

Residential Market Activity

A total of 1,325 homes were sold in the Ottawa area through the MLS® System in July, an increase of 0.2% from July 2025. Although sales declined from June as the spring market gave way to summer, Ottawa retained considerably more of its spring activity than it typically has during recent June-to-July transitions.

Activity continued to vary by property type. Single-family sales rose 5.0% year-over-year to 714 transactions. Townhouse sales declined 4.1% to 417, while apartment sales declined 6.6% to 169. While Townhome and apartment sales both declined compared to 2025, that decline was once again less than the year earlier figures from June.

Year-to-date, 8,288 homes have sold in Ottawa, down 5.2% from the same period in 2025. This July result narrows the year-to-date gap from 6.1% at the end of June. Total year-to-date dollar volume was approximately $5.8 billion, down 5.6% year-over-year.

Prices and Market Balance

The average residential sale price was $683,308 in July, down 1.6% from a year earlier. The median price was unchanged at $635,000.

Taken together with other pricing measures, these figures suggest prices remained broadly stable year-over-year, and that changes in the mix of properties sold influenced the lower average. The MLS® Home Price Index, which is designed in part to adjust for changes in the mix of homes sold, recorded a composite benchmark price of $634,000, down 0.5% year-over-year but up 0.3% from June.

There were 2,530 new listings in July, down 0.8% from a year earlier. Active listings totaled 4,678, up 9.3% year-over-year but down 6.1% from June. Inventory therefore remained high compared with recent historical trends, but the growth in available supply continued to moderate.

The sales-to-new-listings ratio increased from 48.8% in June to 52.4% in July as sales held up comparatively well and fewer new properties entered the market. Months of inventory rose modestly from 3.3 in June to 3.5 in July. Although an increase is typical between June and July, this year’s 0.2-month rise was less than half the median increase recorded over the previous decade.

Other transaction measures were somewhat softer. Homes sold for an average of 97.8% of their listing price, compared with 98.0% in July 2025, while the median time on market increased from 24 to 28 days. July therefore showed improved absorption of incoming listings, but not a broad shift toward tighter market conditions.

Single-family homes remained the steadiest major segment. Months of inventory rose to 3.2, while the single-family benchmark price increased 0.6% year-over-year. Townhouses recorded 3.0 months of inventory, down from June, while the sales-to-new-listings ratio improved to 55.9%. However, the townhouse benchmark price remained 5.1% below last year. The condominium apartment market continued a yearlong trend of having the softest conditions, particularly in downtown Ottawa. Apartments recorded 5.4 months of inventory, a 41.0% sales-to-new-listings ratio and a median of 41 days on market. The apartment benchmark price was down 5.2% year-over-year.

Regional Market Comparison

In July, Ottawa’s suburban markets continued to account for most residential activity, representing more than 70% of all sales. Ottawa Suburb South stood out, with sales rising 8.0% year-over-year while new listings declined 6.6%. Its sales-to-new-listings ratio increased to 55.7%.

Ottawa Suburb West recorded the firmest absorption among the three suburban submarkets, with a sales-to-new-listings ratio of 56.2% and 3.0 months of inventory. Ottawa Suburb East also remained within balanced conditions, with a 54.3% ratio and 3.0 months of inventory.

Conditions remained softer in Ottawa Center. Sales declined 8.3% year-over-year, the sales-to-new-listings ratio was 39.6%, and months of inventory reached 5.6.

Rural results were more variable. Sales increased in Ottawa Rural South and Ottawa Rural West but declined in Ottawa Rural East. These percentage movements should be interpreted cautiously because the smaller number of transactions in rural submarkets means relatively few sales can produce substantial monthly or annual swings.

Overall, the regional data reinforces a market divided by geography as well as property type, with generally firmer suburban absorption and more supply-sensitive conditions in downtown Ottawa. These differences underscore the importance of local market knowledge and a well-prepared comparative market analysis, as citywide figures may not reflect the conditions affecting a particular neighbourhood or property type.

Looking Ahead

Spring concerns about a recession have given way to a more nuanced economic outlook. Statistics Canada reported that real GDP grew 0.3% in May, while the Bank of Canada said in July that there were clear signs economic growth had resumed during the second quarter. Growth remains modest and uncertainty remains elevated, but the backdrop heading into the fall is steadier than it appeared earlier in the year.

The Bank of Canada also held its policy rate at 2.25% in July. While national economic results should not be treated as a direct explanation for Ottawa’s July housing activity, continued growth and stable interest rates provide a more supportive backdrop for housing demand.

In June, the pace of new listings, the direction of inventory and the relative softness of the apartment market were identified as important indicators to watch. One month later, new listings have eased, active inventory has declined from its June level and the sales-to-new-listings ratio has improved. Apartment conditions, however, remain comparatively soft. The key question heading into the fall will be whether the improvement in citywide absorption continues once the market moves beyond the typical summer slowdown.

Media contact

Melanie Coulson
Director of Strategic Communications & Engagement
613-225-2240 ext. 247 | melanie@oreb.ca

Ottawa Market Remains Balanced as Supply Shapes June Conditions

Market Overview

Ottawa’s housing market remained balanced in June, with activity easing in line with typical early-summer patterns, though trailing slightly behind 2025 activity levels. Supply remains elevated by recent years’ standards, continuing to give buyers more choice.

The impact of the elevated inventory is presenting differently by property type: single-family homes remained comparatively steady, townhomes showed more volatility, and apartment-style properties continue to be the softest segment.

Pricing reflected that mixed picture. The average residential sale price was $733,648 in June, up 1.3% from a year earlier, while the median price was $655,000, down 1.3%.

The market continues to unfold against a cautious economic backdrop, though economic indicators are less gloomy than last month leading to some guarded optimism. The Bank of Canada held its policy rate in June, and Statistics Canada reported that real GDP grew in April after contracting in March. At the same time, uncertainty around North American trade policy continues to weigh on the broader economic outlook.

Overall, June showed a market that remains steady but is more divided beneath the surface. Supply is shaping conditions, but not overwhelming them, and the next phase of the market will depend on how well demand continues to absorb available listings across different property types.

“As we move through the summer market, the key story isn’t simply higher inventory, it’s how well demand continues to absorb that supply,” said OREB President Tami Eades. “Ottawa remains a fundamentally balanced market, but we’re seeing clear differences emerge between property types and neighbourhoods. That’s why buyers and sellers should focus less on citywide headlines and more on local market conditions. Working with a REALTOR® who understands those micro-market dynamics is more valuable than ever.”

Residential Market Activity

In June, 1,518 homes were sold through the MLS® System in Ottawa, a 4.9% decrease compared to June 2025. While sales were lower than May’s 1,616, that decline is consistent with the normal transition from the spring market into the early-summer period.

Sales activity varied by property type. Single-family homes continued to account for the largest share of activity, with 879 sales in June, down 1.8% from a year earlier. Townhouse sales totalled 429, down 7.3%, while apartment-style properties recorded 178 sales, down 14.0%.

This reinforces the property-type divide that has been building through the first half of the year: single-family demand has been steadier, while townhomes and especially apartments have carried more of the market softness.

Year to date, 6,969 homes have sold in Ottawa, down 6.1% from the same period in 2025. Total dollar volume was $4.9 billion, down 6.2% year over year. The year-to-date figures point to a market that remains active, but still below last year’s sales pace as the first half of 2026 comes to a close.

Prices and Market Balance

June’s price story was about how supply is being absorbed across different parts of the market. The average price was higher than a year ago, while the median price and benchmark measures were softer, suggesting that property mix continued to influence the headline numbers.

New listings were up year over year, active listings continued to rise, and the sales-to-new-listings ratio settled at 48.8%. Months of inventory reached 3.3, up from 2.8 last June. These figures remain consistent with balanced-market conditions.

Importantly, the additional supply has not translated into a broad weakening in transaction conditions. The sale-to-list price ratio remained at 98.5%, unchanged from June 2025, while the median days on market rose only modestly from 19 to 22 days. That suggests Ottawa is seeing more pricing discipline, not a complete shift in market conditions.

The property-type split is the clearest market-balance signal. Single-family homes remained the most stable segment, with 2.8 months of inventory and the strongest sale-to-list ratio among the major property types.

Townhomes continued to adjust as listings accumulated, with active inventory up 27.6% from last June and months of inventory rising to 3.2.

Apartment-style properties (condos) remained the softest segment, with 5.3 months of inventory and weaker benchmark pricing than the broader market.

The MLS® Home Price Index, which helps adjust for changes in the mix of homes sold, reinforced this divide. The composite benchmark price was down 1.3% year over year, with single-family down 0.7%, townhomes down 3.9%, and apartments down 6.0%.

Overall, June does not point to a market-wide price correction. It points to a balanced market where elevated supply is creating more pricing pressure, and where the clearest signs of high-supply effects remain concentrated in townhomes and apartment-style properties rather than across Ottawa as a whole.

Regional Market Comparison

Ottawa’s regional data reinforced the broader theme of a balanced but uneven market. The three suburban submarkets continued to account for most of the city’s sales activity, led by Ottawa Suburb South with 382 sales, Ottawa Suburb West with 373, and Ottawa Suburb East with 328. Together, those three areas represented more than 70% of Ottawa’s June sales.

The suburban picture was not uniform. Ottawa Suburb South recorded the highest sales total, but Ottawa Suburb West showed the firmest absorption, with the highest sales-to-new-listings ratio among the seven submarkets and the lowest months of inventory.

Ottawa Suburb East remained active, though sales were lower than last year and new listings were up, pointing to more choice for buyers.

Central and rural markets were more uneven. Ottawa Centre recorded 143 sales and had higher months of inventory than the citywide level, while Ottawa Rural East was the only submarket to post year-over-year sales growth. Rural West and Rural South had smaller transaction totals, which makes monthly movements more variable, but both continued to show more supply-sensitive conditions.

Overall, the regional data points to a market shaped by local differences rather than one broad trend. Suburban areas continue to drive most activity, but absorption, supply, and pricing conditions vary meaningfully by area.

Looking Ahead

As Ottawa moves through the summer market, the most useful signals will come less from any single month of sales and more from whether demand continues to absorb elevated supply at a steady pace. REALTORS® should be watching the sales-to-new-listings ratio, months of inventory by property type, median days on market, and whether price trends continue to diverge between single-family, townhouse, and apartment-style properties.

CMHC’s latest data adds important context to the supply story. Ottawa had 17,212 housing units under construction in May,with nearly 14,000 of those apartment units. Combined with national demographic data pointing to slower population growth and fewer non-permanent residents, there remains the possibility of an influx of apartment-style units into the market in a way that could significantly impact market conditions.

While this does not point to an immediate oversupply issue as completed and unabsorbed apartment inventory remains low with 37 apartment units reported in May; it does suggest future pressure will depend less on construction activity itself and more on whether demand continues to keep pace as projects are completed.

The rental side should also be monitored carefully. CMHC reported a 3.0% primary rental vacancy rate in Ottawa in 2025, while the condominium rental vacancy rate was much tighter at 0.6%. That means the apartment outlook is not simply a story of excess supply. It is a question of how resale demand, rental demand, investor activity, and new apartment completions interact over time.

REALTORS® in Ottawa, as always, would do well to thoroughly understand the micro-market they are operating in for their clients.

Media contact

Melanie Coulson
Director of Strategic Communications & Engagement
613-225-2240 ext. 247 | melanie@oreb.ca

Seasonal Activity Improves, but Ottawa’s May Market Remains Cautious

Market Overview

Ottawa’s housing market remained balanced in May, with activity improving from April but continuing to trail last year’s spring pace. A total of 1,616 homes sold in May, up from 1,336 in April, reflecting the typical lift as the spring market progressed. However, sales were down 10.6% compared to May 2025. These slower sales are becoming a theme thus far in 2026, even as the market remains active.

The sales-to-new-listings ratio rose to 48.2%, while months of inventory eased to 3.0, indicating demand kept better pace with new supply than it did in April. Active listings remained elevated at 4,917, keeping pressure on sellers to price strategically.

Average prices across market segments were mixed, though overall pricing remained relatively stable. Single-family home pricing was flat year over year, while average prices for townhomes and apartments saw modest declines. Overall pricing was less than one percentage point below last year’s level, indicating continued market stability. The average residential sale price was $721,270 in May, up from $712,184 in April, and relatively flat at 0.9% below May 2025. The median sale price followed a similar pattern, rising to $660,000 from $650,000 in April while remaining 1.6% lower than last May.

Performance varied by property type. Single-family homes remained resilient, with average prices essentially unchanged year over year and the median price up 1.3%. Townhomes and apartment-style properties continued to face softer conditions, with both average and median prices below last year’s levels.

The MLS® Home Price Index (HPI) composite benchmark price increased 0.9% from April but remained 0.6% below May 2025, reflecting continued variation across market segments.

Economic uncertainty continues to influence market activity. Recent GDP data has fueled discussion about Canada’s economic momentum, while the Bank of Canada has continued to take a cautious approach to interest rates. CMHC data reported lower employment levels in the first quarter compared to a year earlier, while CREA’s labour-market charts point to stronger full-time job growth and an unemployment rate that has eased from its early-2026 peak.

Ottawa’s market remains balanced, but the data also points to clear challenges. Sales continue to lag last year’s pace, inventory is elevated, and softer segments are weighing on the broader price picture. The strength of the summer market will depend on whether demand continues to absorb supply at a steady pace.

“The Ottawa market is not moving in one direction across all property types,” says OREB President Tami Eades. “May brought the seasonal increase in activity we typically expect to see in Ottawa’s housing market, but sales continue to trail last year’s pace. While economic uncertainty continues to influence consumer confidence, the key question moving into the summer market will be whether demand continues to keep pace with supply. The market remains active, but inventory levels, employment trends, and buyer confidence will all play an important role in shaping the months ahead.”

Residential Market Activity

In May, 1,616 homes were sold through the MLS® System in Ottawa, a 10.6% decrease compared to May 2025, but a clear increase from 1,336 sales in April. The month-over-month gain reflects the typical spring lift in activity, even as demand continues to trail last year’s stronger spring pace.

Sales activity was down in May compared to 2025, though the extent of that decline varied by property type. Single-family homes recorded 904 sales in May, down 8.6% from a year earlier. Townhouse sales totalled 481, down 14.3%, while apartment-style properties recorded 203 sales, down 12.1%. The segment-level results point to a market where demand remains present, but activity is trailing 2025 across all segments.

Supply remained elevated. New listings totalled 3,351 in May, down 2.2% from May 2025, while active listings rose to 4,917 units, up 12.2% year over year and above April’s 4,535 listings. While new listings did not surge this month, the elevated level of active inventory shows that supply has continued to accumulate.

The sales-to-new-listings ratio improved to 48.2%, up from 41.0% in April and consistent with balanced market conditions.

Year to date, 5,453 homes have sold in Ottawa, down 6.3% from the same period in 2025. New listings total 12,284, up 5.4%, while average active listings are up 14.8%. The year-to-date sales-to-new-listings ratio of 44.4% and 3.5 months of inventory point to a market that remains balanced overall, but one where sellers face more competition than they did last spring.

Prices and Market Balance

Price trends remained stable in May, but they were not uniform across property types. The average residential sale price in May was $721,270, down 0.9% from May 2025 but up from $712,184 in April. The median price was $660,000, down 1.6% year over year and up from $650,000 in April. Year to date, the average price is $694,539, down 0.6%, while the median price is $639,000, down 1.7%.

Single-family homes remained the most resilient segment, with an HPI benchmark price of $723,800, up 0.9% from April and 0.3% year over year. The average single-family sale price was essentially unchanged from last May, while the median price rose 1.3% to $800,000.

The townhome segment softened in May data compared to recent months. Earlier in the year, townhome activity was holding up comparatively well, but May reversed that pattern. Townhouse sales fell 14.3% year over year, pulling year-to-date sales 2.8% below 2025. Pricing has not fallen sharply month over month, with the townhouse HPI benchmark at $557,500, down 0.4% from April and 3.2% from last May. The larger signal is softer absorption, as active listings remain elevated and months of inventory sit well above last year’s level.

Apartment-style properties continued to show the most pronounced pressure. The apartment benchmark price was $385,500, up 1.5% from April but down 6.7% from May 2025. Average and median apartment prices were also lower year over year. This weakness is not unique to Ottawa; Toronto’s condo sector has also been affected by weaker investor demand and higher carrying costs. Ottawa’s apartment segment, however, should still be understood within local conditions: the data points to a slower, more price-sensitive segment, not a broad market correction.

Months of Inventory:

  • Single-Family: 2.7
  • Townhome: 2.7
  • Apartment: 4.8


Ottawa is not experiencing broad-based price growth, but neither is the market showing a uniform decline in price. Single-family homes continue to provide support, townhomes are adjusting, and apartment-style properties remain the softest part of the market. For sellers, accurate pricing remains critical; for buyers, the data points to a market where patience and property-specific analysis matter more than broad assumptions about Ottawa as a whole.

Regional Market Comparison

Ottawa’s regional picture was uneven in May, reinforcing that the citywide market is not moving as one single market. The central market and Ottawa Rural West were the only subareas to record year-over-year sales gains, while the suburban areas continued to drive most of the overall activity.

Ottawa Centre had the clearest positive activity signal, with sales up 13.5% from May 2025 and prices also higher year over year. This suggests stronger engagement in the central market after a softer start to the year, though the area’s varied property mix means monthly price movements should be interpreted with some caution.

The suburban markets remained the core of Ottawa’s sales activity, but the story differed by area. Ottawa Suburb West recorded the highest sales total and the lowest months of inventory, pointing to relatively stronger absorption. However, prices were lower than last May, so its strength was more about activity than price growth. Ottawa Suburb South remained steady but softer than last year, while Ottawa Suburb East saw a sharper decline in sales even as prices moved higher.

Rural markets were more variable, which is typical given smaller transaction volumes. Ottawa Rural West was the relative bright spot, with sales slightly above last May, while Ottawa Rural East and Rural South both recorded weaker activity. Rural East also had the highest inventory level among the subareas, pointing to slower absorption.

Overall, the regional data points to a market shaped by local differences rather than one broad trend. Central Ottawa improved in May, the west remained active, and rural conditions were more uneven. For buyers and sellers, neighbourhood, property type, and local competition continue to matter more than the citywide averages alone. Detailed regional tables are available in the non-HPI report included in the monthly stats package.

Looking Ahead

As Ottawa moves into the summer market, the most useful signals will come less from broad forecasts and more from whether demand continues to absorb supply at a steady pace. REALTORS® should be watching the sales-to-new-listings ratio, months of inventory by property type, median days on market, sale-to-list ratios, and whether benchmark prices continue to diverge between single-family, townhouse, and apartment-style properties.

CMHC’s latest construction data adds important context. Housing starts were lower year over year across all dwelling types in April, but the pipeline is shifting in composition. Rental projects accounted for 61% of starts by market type, while apartments made up most new starts and the large majority of units currently under construction. That changing mix will matter most for apartment-style resale pricing, investor demand, and rental-market competition as projects move toward completion.

Completed and unabsorbed inventory should also be monitored closely. CMHC’s April data shows this inventory has risen, with the largest concentration in row and single-detached homes. For REALTORS®, absorption of newly completed units will be an important companion indicator to resale inventory, especially in segments where pricing has already become more sensitive.

Taken together, the indicators to watch are clear: resale inventory, new listings, absorption of completed new homes, the apartment-heavy construction pipeline, and local employment conditions. These will offer a better read on Ottawa’s next phase than any single month of sales or pricing data alone.

Media contact

Melanie Coulson
Director of Strategic Communications & Engagement
613-225-2240 ext. 247 | melanie@oreb.ca


Spring Activity Builds as Ottawa Market Remains Balanced

Market Overview

Ottawa’s housing market continued its seasonal rebound in April, with activity picking up month-over-month, following a slower winter. Inventory levels, which have been rising since late summer 2025, remain elevated, but stable. The spring increase in new listings has added to this supply, giving buyers more choice and flexibility.

The broader economic backdrop remains mixed. The Canadian Real Estate Association (CREA) recently revised its 2026 forecast downward, citing a weaker-than-expected start to the year and renewed inflation pressures, partly driven by rising energy costs. As a result, expectations for both sales and price growth have been tempered, with only modest gains now anticipated nationally.

Interest rate expectations have shifted. Earlier concerns that inflation could lead to rate increases contributed to more cautious buyer behaviour over the winter. With rates now holding steady, that immediate risk has eased. While borrowing costs remain above pandemic-era lows, they are more in line with long-term norms. A more stable rate environment may help reduce hesitation and support a gradual improvement in activity as buyer confidence strengthens.

“We’re seeing the market find its footing after a slower winter,” said OREB President Tami Eades. “April’s activity reflects a market that is gradually regaining momentum. Buyers are beginning to re-engage, and more listings are helping to keep conditions balanced across most segments.”

Residential Market Activity

In April, 1,336 homes were sold, down 1.9% year over year, but up from 1,075 in March.

New listings rose sharply to 3,258 units (+19.3%), pushing active listings to 4,535 units (+17.2%).

With listings continuing to outpace sales, the sales-to-new-listings ratio came in at 41.0%, consistent with balanced market conditions. Homes are taking slightly longer to sell, with median days on market increasing to 21 days, up from 18 days in April 2025.

Year to date, 3,839 homes have been sold, down 4.4% compared to the same period in 2025. While activity remains below last year’s levels, recent trends suggest that the 2026 market may be gradually strengthening.

New listings total 8,933 units (+8.5%), while active listings have increased 16.0%.

Prices and Market Balance

Home prices held steady in April. The average sale price was $712,184 (+0.8% year over year), and the median price was $650,000, unchanged from April 2025. Year-to-date, the average price stands at $683,303, and the median price is $630,000, both showing little change compared to the same period last year.

The MLS® Home Price Index provides additional context, indicating that benchmark prices have begun to stabilize following earlier declines. Most segments recorded modest month-over-month gains, apart from condo-apartments, which continue to lag. This aligns with the broader trend of price stabilization observed over recent months.

Market balance continues to be shaped primarily by supply. Active listings reached 4,535 units in April, up 17.2% year over year, while new listings also posted strong gains.

With a sales-to-new-listings ratio of 41.0% and 3.4 months of inventory, Ottawa remains in balanced territory. Compared to recent years, conditions are less competitive, with buyers benefiting from increased choice, and sellers facing more competition.

Months of Inventory:

  • Single Family: 3.1
  • Townhome: 3.0
  • Apartment: 4.9

Regional Market Comparison

Market conditions across Ottawa’s subareas continue to vary.

Ottawa Centre appears relatively stable from a pricing standpoint, but activity has eased. Sales are lower compared to recent years, while inventory has increased, resulting in slower absorption. This is largely due to the area’s higher concentration of condo-apartment units, which has been the softest segment of Ottawa’s market for several months.

Suburban markets across the east, south, and west remain generally balanced. Sales-to-new-listings ratios and inventory levels are within typical historical ranges, although sales activity has moderated in some areas, and supply has trended higher. Among these, the western suburbs stand out as the strongest segment, with more consistent sales activity, and slightly tighter inventory conditions.

Rural markets continue to operate at a slower pace, with higher inventory levels, and longer selling times compared to suburban areas. This results in more buyer-friendly conditions, along with greater variability in pricing data due to lower transaction totals.

Overall, while Ottawa’s market remains balanced at a high level, local conditions vary. Suburban areas are the most stable, with the west currently leading in activity. Central areas are seeing more moderate demand, while rural markets continue to experience slower absorption, contributing to a more varied regional landscape. Those interested in exploring these dynamics further can access the non-HPI report in the monthly stats package here.

Looking Ahead

Ottawa’s spring market continues to build momentum, with activity improving from the slower pace seen earlier this year. While sales have yet to fully offset the winter slowdown, recent gains suggest the market is beginning to regain ground as the season progresses.

Despite ongoing economic uncertainty, Ottawa continues to demonstrate relative stability. Prices have remained in a narrow range, and demand, while measured, continues to support balanced conditions rather than any sharp shift in either direction.

Inventory will remain a key factor to watch. Supply levels have been elevated for several months and continue to build through the spring, giving buyers more choice and increasing competition among sellers. If this trend persists, however, higher inventory could begin to place downward pressure on pricing and influence seller expectations in the months ahead.

Media contact

Melanie Coulson
Director of Strategic Communications & Engagement
613-225-2240 ext. 247| melanie@oreb.ca


Spring Momentum Builds as Ottawa Market Begins Catching Up with Supply

Market Overview

Ottawa’s housing market showed clearer signs of early spring momentum in March, with sales activity strengthening after a prolonged, slower winter market. While transactions remain below typical March levels, the pace of improvement has accelerated, particularly in the single-family segment.

Inventory continues to rise, but stronger sales are keeping pace with new supply. This is leading to a gradual tightening in market conditions, reflected in declining months of inventory, and more consistent absorption across all segments.

Pricing trends also suggest a market that is beginning to firm. The MLS® Home Price Index recorded a second consecutive month of gains across most property types, indicating strengthening underlying values as the spring market takes shape. Overall, Ottawa remains in balanced territory, with momentum building as demand re-engages.

“March’s activity is a clear sign that Ottawa’s market doesn’t move in dramatic shifts,” said Tami Eades, President of the Ottawa Real Estate Board (OREB). “What we’re seeing is a measured, steady return to activity. Inventory is up, sales are improving, and pricing is firming without overheating. We expect a more active and stable market in the months ahead.”

Residential Market Activity

In March, 1,075 residential properties sold in Ottawa, down 4.7% year over year. This marks an improvement from February’s 6.8% decline, and signals strengthening demand as the spring market takes hold.

While sales remain slightly below recent March levels, they are now within range of prior years:

  • 2025: 1,128
  • 2024: 1,158
  • 2023: 1,072

Total dollar volume of sales reached $744.5 million in March, down 3.8% year over year.

Year-to-date, 2,474 homes have sold, a 5.7% decline from 2025, while dollar volume sits at $1.66 billion (-6.5%). Despite this, March showed stronger momentum than earlier in the year, driven in part by single-family homes, which recorded 562 sales, unchanged year over year, and well above February’s 358.

This increase in activity helped absorb supply. Months of inventory declined to 3.3 in March from 3.8 in February, indicating that while buyers still have choice, sales are keeping better pace with new listings.

Prices and Market Balance

Home prices in Ottawa remained relatively stable in March. The average residential sale price was $692,584, up 0.9% from March 2025, while the median price was $642,000, down 0.5% year over year.

Year to date:

  • Average price: $670,360 (-0.9%)
  • Median price: $625,000 (-1.1%)

These figures represent an improvement compared to February.

While headline prices show modest movement, the MLS® Home Price Index points to firmer underlying trends. Benchmark prices rose month over month in the composite, single-family, and apartment segments, while townhomes remained stable. Because the HPI adjusts for the mix of homes sold, it provides a clearer view of true price movement, and suggests values are beginning to firm.

Supply continued to build:

  • New listings: 2,452 (+7.5%)
  • Active listings: 3,578 (+10.3%)

The sales-to-new-listings ratio was 43.8%, keeping Ottawa in balanced market territory.

Months of Inventory:

  • Single-family: 3.0
  • Townhomes: 2.8
  • Apartments: 5.5

This indicates tighter conditions in detached and townhome segments, while apartments continue to face higher supply, and more price pressure.

Looking Ahead

March data suggests Ottawa’s spring market is taking shape, with improving sales, firmer pricing signals, and more effective absorption of inventory. While activity has not fully returned to long-term averages, the pace of recovery is strengthening.

Rising benchmark prices, and declining months of inventory point to gradually tightening conditions within an overall balanced environment.

CREA’s 2026 outlook anticipates strengthening demand as borrowing conditions ease. Ottawa’s recent performance is beginning to align with that trajectory, with early signs of a typical spring pickup now emerging. If current trends continue, the market is likely to see steady momentum in the months ahead, without a sharp shift in balance.

Recent federal and provincial announcements represent one of the most significant aligned housing policy efforts in recent years, and will likely spur activity in Ottawa’s housing market.

Media contact

Melanie Coulson
Director of Strategic Communications & Engagement
613-225-2240 ext. 247| melanie@oreb.ca


OREB Welcomes Pro-Housing Measures in the 2026 Ontario Budget

OTTAWA, ON – The 2026 Ontario Budget comes at a critical time for Ottawa’s housing market, as pent-up demand, persistent supply shortages, rising development, and ownership costs continue to impact affordability, limit mobility for Ontarians, and restrict available housing at certain price points and inventory types.   

The Ottawa Real Estate Board (OREB) welcomes the removal of the full 13 per cent HST on qualifying new home purchases through a combined provincial and federal rebate from April 1, 2026, to March 31, 2027, subject to federal legislation. Eligible buyers could receive up to $130,000 in relief, with full benefits applying to homes valued up to $1 million.  

By lowering upfront costs, this time-limited rebate is expected to provide short-term relief for homebuyers, support move-up activity, and encourage additional housing supply. It represents a meaningful step toward reducing upfront barriers at a time when many households continue to face barriers to entering or moving within the housing market.  

OREB also welcomes the province’s investment in housing-enabling infrastructure, alongside the $1.2 billion Building Faster Fund to support municipalities delivering new homes, and continued investments in supportive housing. These measures are essential to unlocking supply.  

The province’s commitment to work with the federal government to support municipalities that reduce development charges is also a crucial step, as these costs remain a key driver of housing affordability.  

Together, these measures reflect the coordinated, multi-level government approach OREB has consistently called for and builds on sustained advocacy from the Canadian Real Estate Association (CREA), Ontario Real Estate Association (OREA), and partners across the real estate and homebuilding sectors.  

OREB recognizes the leadership of Finance Minister Peter Bethlenfalvy and Premier Doug Ford and will continue to advocate on behalf of REALTORS® for practical, permanent solutions that reduce costs, accelerate housing supply, and deliver meaningful progress for consumers in Ottawa and across Ontario.  

Balanced Conditions Define Ottawa’s Housing Market in January

Market Overview

Ottawa’s residential market entered 2026 on a balanced footing. Inventory levels remain higher than in recent years, giving buyers more choice, while sellers continue to adjust to conditions that reward accurate pricing and patience. Benchmark prices are down year over year across all housing types, with softer conditions most evident in townhouses and apartments. Detached homes continue to show greater price stability. Overall, January’s data points to a market that is operating more evenly, rather than one under broad-based pressure.

“What January is showing us is a market that’s adjusting in a healthy way,” said Tami Eades, President of the Ottawa Real Estate Board. “We’re seeing more choice for buyers, more realism on the selling side, and pricing that’s responding to those conditions without sharp swings. That kind of balance is a sign of stability, not stress.”

Residential Market Activity

In January, 610 residential properties sold in Ottawa, reflecting a typical post-holiday slowdown while also signalling a steadier start to the year. Sales were 5.6% lower than a year ago but remained within the range of long-term January norms. This points to demand that is still present, even as buyers continue to proceed cautiously amid ongoing affordability considerations.

Pricing activity also reflected seasonal conditions rather than renewed weakness. The average residential sale price was $641,436, down 4.5% from January 2025, a change consistent with winter market dynamics and a more price-sensitive buyer pool. Recent interest rate reductions have begun to ease pressure at the margins. January’s data suggests their impact is appearing first in buyer engagement rather than completed transactions.

The MLS® Home Price Index provides further context. In January, the composite benchmark price declined modestly month over month, with single-family, townhouse, and apartment benchmarks all posting small decreases.

Prices and Market Balance

Supply conditions continue to vary significantly by property type. Overall, new listings totalled 1,522 units, up 8.8% year over year, while active listings reached 2,673. This is an increase of 22.7% from last January. Although inventory levels remain elevated compared to recent seasonal norms, growth has slowed, helping to prevent a buildup of excess supply.

With months of inventory at 4.4, Ottawa’s market is operating closer to long-term, pre-pandemic averages. This level of supply is providing buyers with more choice and negotiating flexibility, while still allowing well-priced homes to attract solid interest. Rather than putting sharp downward pressure on prices, current inventory levels are supporting a more balanced market.

Property Type Breakdown

As noted above, differences in market performance by property type continued to shape Ottawa’s market in January.

Single-Family Homes

Detached homes remained the market’s most stable segment, even as winter conditions weighed on overall activity. In January, 276 single-family homes sold, down 13.8% year over year. Supply levels remained comparatively balanced at 4.3 months of inventory, supported by 1,177 active listings, and 663 new listings, essentially flat year over year. 

Prices softened modestly. The average sale price was $793,874, down 3.6% year over year, while the median price held at $750,000, unchanged from last January. Together, these indicators suggest that detached home pricing is adjusting in an orderly manner. The single-family benchmark price also edged lower year over year, marking a shift from the modest gains seen late last year; the decline remains limited. 

Townhomes

Townhome sales rose to 215 units, up 6.4% year over year, while new listings increased sharply to 487, up 45.8% from January 2025 and well above December’s 176 new listings. Active listings climbed to 708, a 67.0% increase year over year. 

As supply increased, leverage has shifted modestly toward buyers. Months of inventory rose to 3.3, and pricing reflected this adjustment. The average townhouse sale price was $536,106, down 3.3% year over year, while the median price declined 3.4% to $560,000. The townhouse benchmark price was down 3.2% year over year, but rose 1.0% compared to December. 

Apartments

The apartment segment showed a constructive month-over-month shift in January, marking a contrast to late 2025. In January, apartment-condo sales increased to 95 from 78 in December, and months of inventory decreased to 6.8 from 7.9, an indication of stronger absorption.  

At the same time, supply expanded meaningfully. New listings rose to 312 from 144 in December, and active listings increased to 647 from 617. In other words, January brought a sizeable seasonal influx of condo listings, but improved sales activity helped prevent a further deterioration in market balance.  

Pricing in this segment remains the most sensitive anywhere across the Ottawa market. The average apartment sale price was $388,307, down 12.1% from January 2025 and lower than December’s $401,465. While condo pricing continues to adjust, January’s combination of higher sales and lower months of inventory suggests that conditions may be starting to stabilize. 

Months of Inventory:

  • Single Family: 4.3
  • Townhome: 3.3
  • Apartment: 6.8

Looking Ahead

January’s data reflects a familiar winter pattern, with slower sales and cautious buyer behaviour shaped by seasonal factors and ongoing economic uncertainty. At the same time, there are early signs that market conditions are beginning to firm. The apartment segment, in particular, showed improving absorption, with lower months of inventory alongside higher sales and dollar volume.

Townhome activity held up, while detached trends remained steady, reinforcing a market that is segmented by property type but remains largely balanced overall.

This picture aligns with CREA’s outlook for 2026, which anticipates improving conditions as lower interest rates gradually draw more sidelined demand back into the market. January supports a credible case for a stronger spring market if rate reductions continue to ease affordability pressures.


About the Ottawa Real Estate Board

The Ottawa Real Estate Board (OREB) is a non-profit association representing more than 4,000 member REALTORS® in the National Capital Region. OREB advocates for policies that promote housing affordability, protect consumers, and support a fair and efficient real estate marketplace.

Media contact

Melanie Coulson
Director of Strategic Communications & Engagement
613-225-2240 ext. 247| melanie@oreb.ca


Balanced but Softening: Ottawa Housing Market Shifts Toward Higher Supply

Ottawa eased into a slower market rhythm in November, shaped by early winter weather and a cautious economic environment. Sales declined from October and fell below November 2024 levels. Although active listings dipped month over month, months of inventory (MOI) rose again after tightening earlier in the fall. The market remained broadly balanced, but the data shows a tilt toward higher supply, with November’s seasonal slowdown more pronounced than usual.

Recent rate cuts offer some optimism for renewed buyer engagement through the typically quiet winter months, setting the stage for a steadier start to the new year and a more energized spring. At the same time, elevated inventory in the townhome and apartment segments warrants ongoing attention to ensure clients understand the current dynamics.


November Snapshot: Home Sales in Ottawa

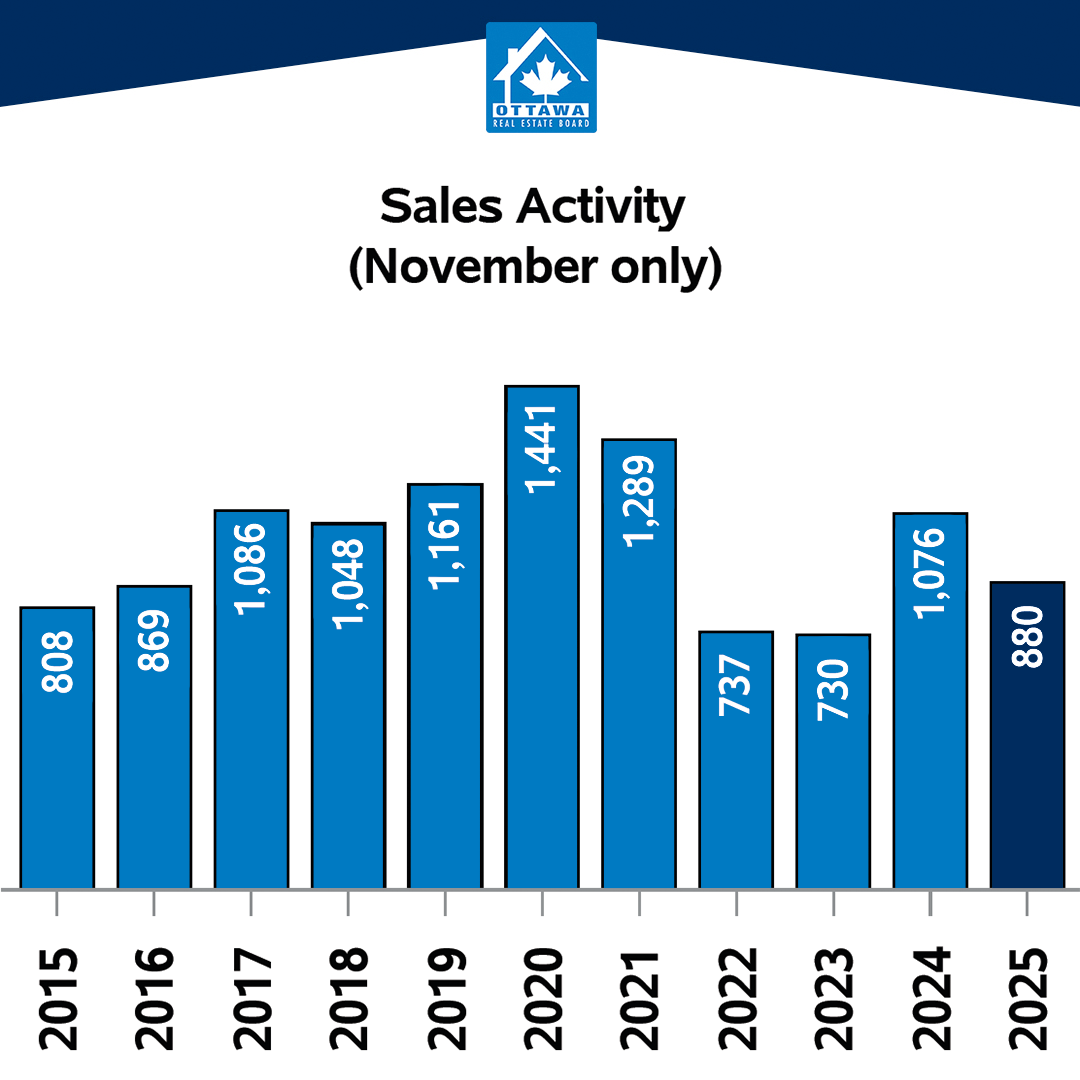
  • November total sales: 880, down from 1,177 in October 2025
  • 18.2 per cent lower than November 2024
  • Year-to-date sales remain 1.5 per cent ahead of this point in 2024
  • Average sale price: $680,496, up a little more than 2 per cent year over year
  • Year-to-date average: near $700,000, 3 per cent higher than a year ago
  • Gains are largely driven by single-family sales, which continue to climb
  • Single-family homes averaged $825,827 in November 2025, up 4.8 per cent compared with November 2024 and up 4 per cent year-to-date


Supply Continues to Build

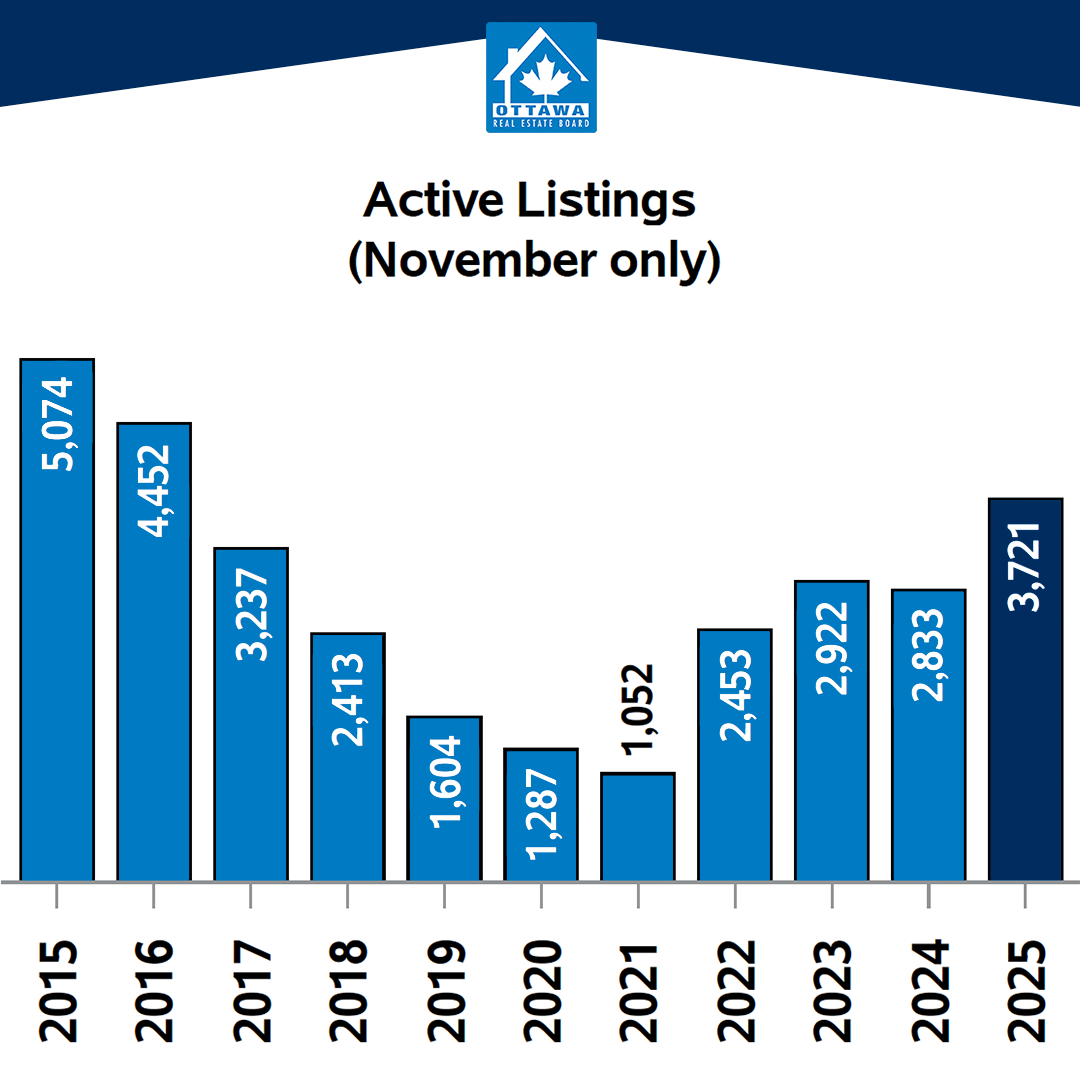
While inventory typically climbs in November, the increase this year is more pronounced. Active listings reached 3,721, and months of inventory rose to 4.2, a meaningful shift from last year’s tighter conditions. That additional choice is influencing pricing and buyer behaviour across property types. Townhomes averaged $542,607 in November, down from both October and last year’s year-to-date figures. Apartments face the most supply pressure: condo MOI climbed above seven and sales were down by more than a third year over year. Prices in this segment have held up better than townhomes on an annual basis, but the volume of available product signals a softer environment than the stable average sale price suggests.

Ottawa’s apartment market is particularly important to watch in light of Toronto’s experience. Toronto is working through one of the most significant buildups of condo inventory in recent memory, putting clear pressure on prices. Ottawa is not in the same position, but the increase in apartment inventory is real. REALTORS® will want to monitor this segment closely through the winter, especially if listings continue to rise faster than sales. Nearly 70 per cent of new home starts this year are concentrated in rental and condo projects, creating a substantial pipeline of multi-unit supply coming online in the coming years. While these starts influence the long-term rather than the immediate picture, they remain a key factor to watch. Toronto’s condo supply challenges emerged over several years as resale listings accumulated alongside an influx of new completions.


Residential Market Activity: Big Picture

  • Total 2025 home sales to date: 13,075
  • Increase in home sales compared with 2024: 1.5 per cent
  • Average sale price in November: $680,496
  • Increase in sale price from 2024: 2.2 per cent, down more than 4 per cent from October*
  • Year-to-date average home price: $699,635, a 3.0 per cent increase over the first 11 months of 2024
  • Total value of homes sold in November: $599 million (16.5 per cent decrease year over year)
  • Year-to-date sales: more than $9 billion, a 4.6 per cent increase over 2024
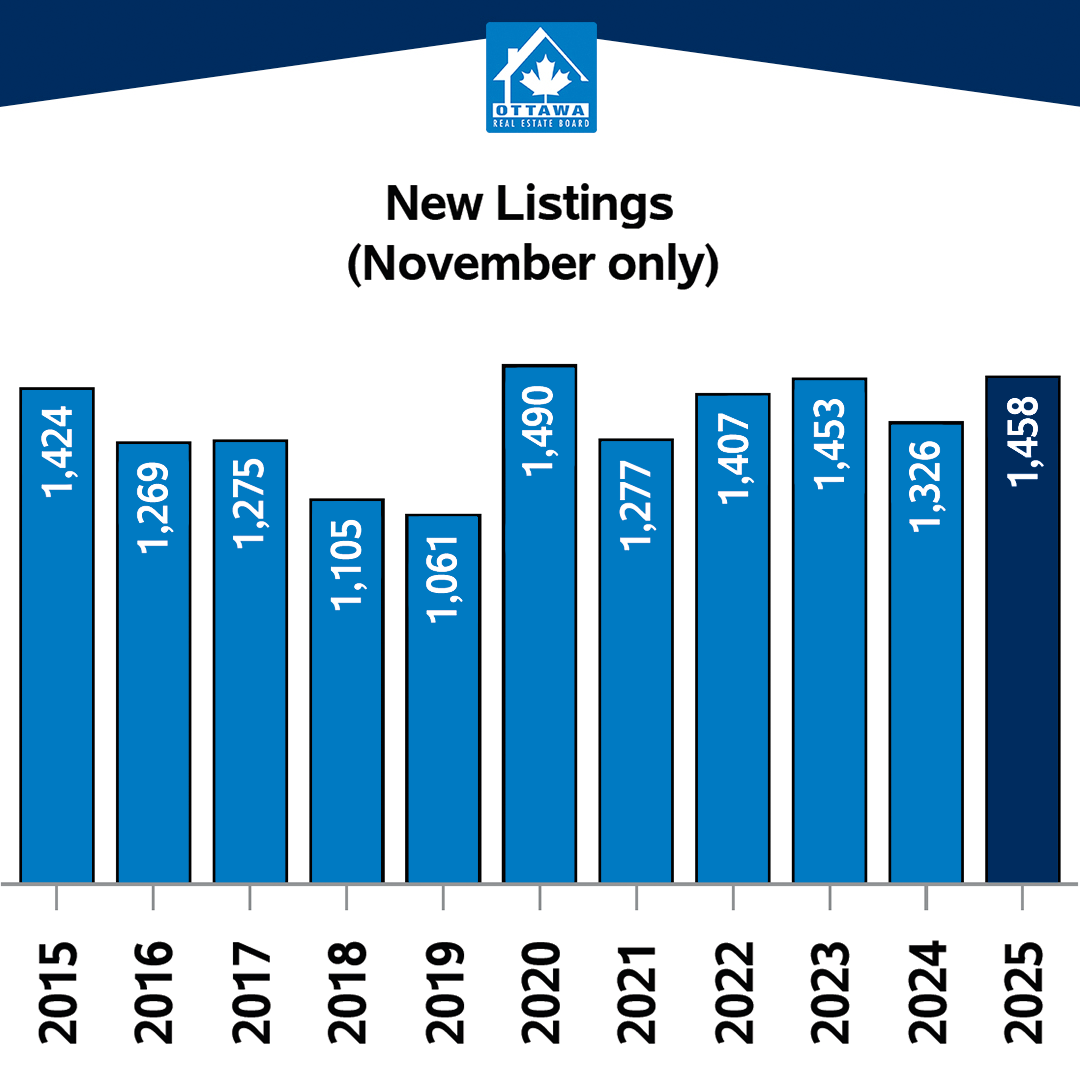
  • New residential listings in November: 1,458, down 39 per cent from October but 10 per cent higher than November 2024
  • November active listings: 3,721, a 12 per cent decrease from October but 31.3 per cent higher than 2024

*Prices typically decrease from October to November. A 4 per cent drop is notable as it is larger than usual.

This active listing indicator is trending higher than each of the past five years, indicating this is more than the cyclical supply buildup associated with late fall and early winter.

Months of inventory (MOI), a key measure of supply, rose overall from 3.6 in October to 4.2, reflecting what remains a generally balanced market. Though it is worth noting that the disparity in MOI between property types. 


Months of Inventory

  • Single-family: 4.0
  • Townhome: 3.1
  • Apartment: 7.3

OREB is working to resolve a discrepancy in the November HPI data. It will be distributed as soon as possible.


Sales Rise as Inventory Levels Ease in October

OTTAWA, ON — Ottawa’s market continues to be resilient despite broader concerns about economic uncertainty. In October, Ottawa’s housing market experienced a modest, seasonal increase in sales activity accompanied by a reduction in the elevated inventory levels seen in recent months. This points to a stable yet cautious phase for the region as we move into the typically slower winter season.  

Last month, a total of 1,177 homes were sold, up 8.1% from 1,089 in September 2025, but down slightly year over year with a 1.2% decrease compared to October of 2024. The average sale price climbed to $709,002, an increase of 2.7% month over month and 5.7% higher than the same period last year, suggesting that underlying demand remains resilient. 

Ottawa saw 2,405 new listings in October, a 15.1% decline from September 2025, but 13.4% higher than October 2024. This seasonal drop off in new listings between September and October has been a consistent pattern over the past decade. More notably, active listings fell from 4,388 in September to 4,232 in October, a 3.6% decrease. While inventory levels remain higher than in recent years, this familiar fall decrease in active listings suggests that the trend towards elevated supply levels may be starting to stabilize, still within a balanced market range. Reinforcing that trend, the months of inventory measure eased from 4.0 to 3.6, indicating a modest tightening in the balance between buyers and sellers as the fall market settled. 

The Bank of Canada’s second consecutive rate cut on Oct. 29, 2025, lowered the policy rate by 25 basis points to 2.25%, providing additional relief to borrowers and some optimism for an active spring market. However, the bank tempered expectations for further easing, noting in its statement that this is likely the final cut in the current cycle. The Ottawa Real Estate Board (OREB) is monitoring the newly released federal budget and workforce announcements, as cuts in either area have historically affected Ottawa’s housing market given the city’s large federal employment base. 

Overall, Ottawa continues to display a pattern of measured balance, modestly improving demand, steady prices, and a market environment that remains fundamentally healthy as it heads toward year-end. 

“Ottawa’s market continues to demonstrate balance and resilience,” said OREB President Paul Czan. “We’re seeing modest growth in sales activity, stable pricing, and a seasonal easing of elevated inventory levels. The recent rate adjustments provide optimism for the coming months, but economic uncertainty looms, and buyers and sellers remain cautious, watching how broader economic factors play out. The current environment points to a steady market rather than a rapid shift in either direction.” 


Residential Market Activity 

Year to date, 12,197 homes have sold, a 3.3% increase over the first 10 months of 2024. The total dollar volume through October reached $8.55 billion, up 6.5% year over year, while the average year-to-date price stands at $700,869, a 3.0% increase year over year. 

Looking at the bigger picture, there have been 12,197 home sales so far this year, a 3.3% increase compared to the same period in 2024. 

The average sale price for all sold listings in October was $709,002, up 5.7% from last year and 2.7% higher than September. 

The year-to-date average price now stands at $700,869, a 3.0% increase over the first ten months of 2024. 

Altogether, the total value of homes sold in October was approximately $834.5 million, a 4.5% year-over-year increase, and sits just under $8.5 billion year to date, a significant 6.5% increase over the same period of time in 2024.  

On the listing side, there were 2,405 new residential listings added in October, down 15.1% from September but still 13.4% higher than last year.  

Active listings totaled 4,232, a 3.6% decrease from September but 21.3% higher year over year. 

The months of inventory, a key measure of supply, eased from 4.0 in September to 3.6, reflecting a slightly tighter balance between supply and demand within what remains a generally balanced market. 

MLS® Home Price Index (HPI) 

The MLS® Home Price Index (HPI) composite benchmark for Ottawa was $622,700 in October, down 0.7% month over month but up 0.7% year over year, continuing the trend of moderate, sustainable price movements rather than volatility.  

By property category: 

  • Single-family: $692,400 up 0.3% compared to 2024 
  • Townhouse: $456,300 up 6.6% compared to 2024 
  • Apartment: $402,900 up 0.1% compared to 2024 


For media inquiries, please contact: 

Melanie Coulson, Director of Strategic Communications & Engagement

613-225-2240 ext.247  | melanie@oreb.ca